Singapore Airlines 2006 Annual Report Download - page 48
Download and view the complete annual report
Please find page 48 of the 2006 Singapore Airlines annual report below. You can navigate through the pages in the report by either clicking on the pages listed below, or by using the keyword search tool below to find specific information within the annual report.-
 1
1 -
2
-
3
-
4
-
5
-
6
-
7
-
8
-
9
-
10
-
11
-
12
-
13
-
14
-
15
-
16
-
17
-
18
-
19
-
20
-
21
-
22
-
23
-
24
-
25
-
26
-
27
-
28
-
29
-
30
-
31
-
32
-
33
-
34
-
35
-
36
-
37
-
 38
38 -
 39
39 -
 40
40 -
 41
41 -
 42
42 -
 43
43 -
 44
44 -
 45
45 -
 46
46 -
 47
47 -
 48
48 -
 49
49 -
 50
50 -
 51
51 -
 52
52 -
 53
53 -
 54
54 -
 55
55 -
 56
56 -
 57
57 -
 58
58 -
59
-
60
-
61
-
62
-
63
-
64
-
65
-
66
-
67
-
68
-
69
-
70
-
71
-
72
-
73
-
74
-
75
-
76
-
77
-
78
-
79
-
80
-
81
-
82
-
83
-
84
-
85
-
86
-
87
-
88
-
89
-
90
-
91
-
92
-
93
-
94
-
95
-
96
-
97
-
98
-
99
-
100
-
101
-
102
-
103
-
104
-
105
-
106
-
107
-
108
-
109
-
110
-
111
-
112
-
113
-
114
-
115
-
116
-
117
-
118
-
119
-
120
-
121
-
122
-
123
-
124
-
125
-
126
-
127
-
128
-
129
-
130
-
131
-
132
-
133
-
134
-
135
-
136
-
137
-
138
-
139
-
140
-
141
-
142
-
143
-
144
-
145
-
146
-
147
-
148
-
149
-
150
-
151
-
152
-
153
-
154
-
155
-
156
 |
 |

46
Singapore Airlines Annual Report 05/06
FINANCIAL REVIEW
Performance of the Group (continued)
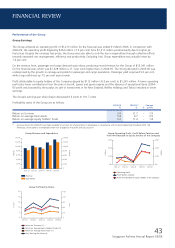
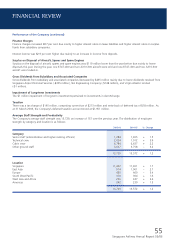
Value Added
Total value added for 2005-06 improved marginally to $5,534 million.
Payroll and other staff cost accounted for 44.8 per cent of the value added, 0.4 percentage point higher than the previous year.
$551 million (10.0 per cent) of the value added was for distribution to equity holders, $96 million (1.7 per cent) for finance
charges, and $69 million (1.2 per cent) belonged to minority interests. $1,985 million was retained for future capital requirements.
Group Value Added Distribution
$ Million
$ Million
2001-02 2002-03 2003-04 2004-05 2005-06
2,500
2,000
1,500
1,000
500
0
Retained in the Business
Employees
Suppliers of Capital
Government
2,500
2,000
1,500
1,000
500
0
R1
R1
-0.6% point
-1.6% points
35.9%
44.8%
12.9%
6.4%
+0.4% point
+1.8% points
Group Valued Added Distribution
2005-06
Employees 2,481.1 44.8
Retained in the Business 1,984.7 35.9
Suppliers of Capital 715.6 12.9
Government 352.6 6.4
Total Value Added
Amount Distribution
$million %
Group Value Added Productivity Ratios
Dollar
Dollar
2001-02 2002-03 2003-04 2004-05 2005-06
Value Added Per $ Employment Cost
Value Added Per $ Revenue
Value Added Per $ Investment in Fixed Assets
2.5
2.0
1.5
1.0
0.5
0
2.5
2.0
1.5
1.0
0.5
0
R1 Excludes write-back of prior year’s tax liabilities of
$204.7 million and $277.8 million for 2003-04 and
2002-03 respectively arising from reduction in
statutory tax rate.