Singapore Airlines 2006 Annual Report Download - page 92
Download and view the complete annual report
Please find page 92 of the 2006 Singapore Airlines annual report below. You can navigate through the pages in the report by either clicking on the pages listed below, or by using the keyword search tool below to find specific information within the annual report.-
 1
1 -
2
-
3
-
4
-
5
-
6
-
7
-
8
-
9
-
10
-
11
-
12
-
13
-
14
-
15
-
16
-
17
-
18
-
19
-
20
-
21
-
22
-
23
-
24
-
25
-
26
-
27
-
28
-
29
-
30
-
31
-
32
-
33
-
34
-
35
-
36
-
37
-
38
-
39
-
40
-
41
-
42
-
43
-
44
-
45
-
46
-
47
-
48
-
49
-
50
-
51
-
52
-
53
-
54
-
55
-
56
-
57
-
58
-
59
-
60
-
61
-
62
-
63
-
64
-
65
-
66
-
67
-
68
-
69
-
70
-
71
-
72
-
73
-
74
-
75
-
76
-
77
-
78
-
79
-
80
-
81
-
 82
82 -
 83
83 -
 84
84 -
 85
85 -
 86
86 -
 87
87 -
 88
88 -
 89
89 -
 90
90 -
 91
91 -
 92
92 -
 93
93 -
 94
94 -
 95
95 -
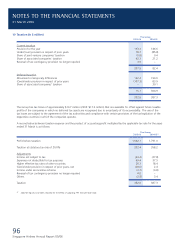
 96
96 -
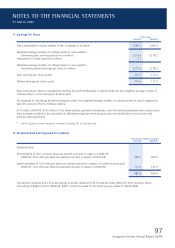
 97
97 -
 98
98 -
 99
99 -
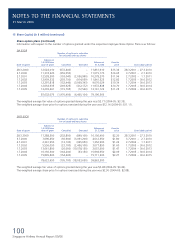
 100
100 -
 101
101 -
 102
102 -
103
-
104
-
105
-
106
-
107
-
108
-
109
-
110
-
111
-
112
-
113
-
114
-
115
-
116
-
117
-
118
-
119
-
120
-
121
-
122
-
123
-
124
-
125
-
126
-
127
-
128
-
129
-
130
-
131
-
132
-
133
-
134
-
135
-
136
-
137
-
138
-
139
-
140
-
141
-
142
-
143
-
144
-
145
-
146
-
147
-
148
-
149
-
150
-
151
-
152
-
153
-
154
-
155
-
156
 |
 |
90
Singapore Airlines Annual Report 05/06
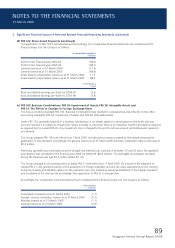
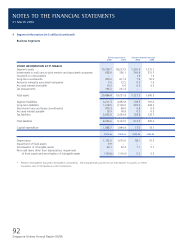
4 Segment Information (in $ million)
Business segments
The Group’s businesses are organised and managed separately according to the nature of the services provided. The following
tables present revenue and profi t information regarding business segments for the fi nancial years ended 31 March 2006 and
2005 and certain assets and liabilities information of the business segments as at those dates.
Airline operations Airport terminal services
2005-06 2004-05 2005-06 2004-05
TOTAL REVENUE
External revenue 12,659.1 11,341.7 371.6 397.2
Inter-segment revenue 43.8 55.5 560.4 578.5
12,702.9 11,397.2 932.0 975.7
RESULTS
Segment result 891.3 1,028.3 184.1 194.2
Finance charges (103.0) (77.5) (6.3) (3.9)
Interest income 90.1 48.9 9.3 3.3
Surplus on disposal of aircraft, spares and spare engines 90.3 215.2 – –
Surplus on disposal of other fi xed assets 10.3 8.1 (0.3) 0.2
Dividends from subsidiary and associated companies, gross 204.6 637.0 – –
Dividends from long-term investments, gross 12.3 2.8 0.6 0.6
Impairment of long-term investments (1.0) (0.1) – –
Amortisation of goodwill on consolidation – – – (0.1)
Amortisation of deferred gain – – 1.4 1.3
Share of profi ts of joint venture companies 20.7 4.5 – –
Share of profi ts of associated companies 112.2 85.7 57.3 50.5
Exceptional items – 69.3 – (28.8)
Taxation (280.9) (389.5) (56.9) (49.2)
Profi t for the fi nancial year 1,046.9 1,632.7 189.2 168.1
Attributable to:
Equity Holders of the Company
Minority interests
*
Relates to inter-segment transactions eliminated on consolidation. The Group generally accounts for such inter-segment transactions as if these
transactions were to third parties at current market prices.
NOTES TO THE FINANCIAL STATEMENTS
31 March 2006