Singapore Airlines 2006 Annual Report Download - page 57
Download and view the complete annual report
Please find page 57 of the 2006 Singapore Airlines annual report below. You can navigate through the pages in the report by either clicking on the pages listed below, or by using the keyword search tool below to find specific information within the annual report.-
 1
1 -
2
-
3
-
4
-
5
-
6
-
7
-
8
-
9
-
10
-
11
-
12
-
13
-
14
-
15
-
16
-
17
-
18
-
19
-
20
-
21
-
22
-
23
-
24
-
25
-
26
-
27
-
28
-
29
-
30
-
31
-
32
-
33
-
34
-
35
-
36
-
37
-
38
-
39
-
40
-
41
-
42
-
43
-
44
-
45
-
46
-
 47
47 -
 48
48 -
 49
49 -
 50
50 -
 51
51 -
 52
52 -
 53
53 -
 54
54 -
 55
55 -
 56
56 -
 57
57 -
 58
58 -
 59
59 -
 60
60 -
 61
61 -
 62
62 -
 63
63 -
 64
64 -
 65
65 -
 66
66 -
 67
67 -
68
-
69
-
70
-
71
-
72
-
73
-
74
-
75
-
76
-
77
-
78
-
79
-
80
-
81
-
82
-
83
-
84
-
85
-
86
-
87
-
88
-
89
-
90
-
91
-
92
-
93
-
94
-
95
-
96
-
97
-
98
-
99
-
100
-
101
-
102
-
103
-
104
-
105
-
106
-
107
-
108
-
109
-
110
-
111
-
112
-
113
-
114
-
115
-
116
-
117
-
118
-
119
-
120
-
121
-
122
-
123
-
124
-
125
-
126
-
127
-
128
-
129
-
130
-
131
-
132
-
133
-
134
-
135
-
136
-
137
-
138
-
139
-
140
-
141
-
142
-
143
-
144
-
145
-
146
-
147
-
148
-
149
-
150
-
151
-
152
-
153
-
154
-
155
-
156
 |
 |

55
Singapore Airlines Annual Report 05/06
Performance of the Company (continued)
Finance Charges
Finance charges increased 38.7 per cent due mainly to higher interest rates on lease liabilities and higher interest rates on surplus
funds from subsidiary companies.
Interest income was 82.9 per cent higher due mainly to an increase in income from deposits.
Surplus on Disposal of Aircraft, Spares and Spare Engines
Surplus on the disposal of aircraft, spares and spare engines was $119 million lower than the year before due mainly to fewer
disposals this year. During the year, one B747-400 and two A310-300 aircraft were sold and one B747-400 and two A310-300
aircraft were traded-in.
Gross Dividends from Subsidiary and Associated Companies
Gross dividends from subsidiary and associated companies decreased by $435 million mainly due to lower dividends received from
Singapore Airport Terminal Services (-$305 million), SIA Engineering Company (-$148 million), and Virgin Atlantic Limited
(-$1 million).
Impairment of Long-term Investments
The $1 million impairment of long-term investments pertained to investments in AeroXchange.
Taxation
There was a tax charge of $195 million, comprising current tax of $213 million and write back of deferred tax of $18 million. As
at 31 March 2006, the Company’s deferred taxation account stood at $1,951 million.
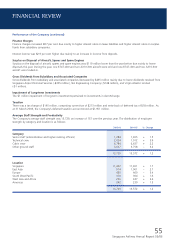
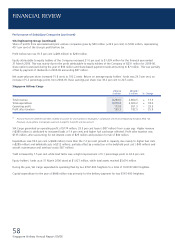
Average Staff Strength and Productivity
The Company’s average staff strength was 13,729, an increase of 157 over the previous year. The distribution of employee
strength by category and location is as follows:
2005-06 2004-05 % Change
Category
Senior staff (administrative and higher ranking officers) 1,284 1,265 + 1.5
Technical crew 2,024 1,912 + 5.9
Cabin crew 6,784 6,637 + 2.2
Other ground staff 3,637 3,758 – 3.2
13,729 13,572 + 1.2
Location
Singapore 11,452 11,261 + 1.7
East Asia 974 1,001 – 2.7
Europe 435 460 – 5.4
South West Pacific 370 364 + 1.6
West Asia and Africa 256 247 + 3.6
Americas 242 239 + 1.3
13,729 13,572 + 1.2
FINANCIAL REVIEW