Singapore Airlines 2006 Annual Report Download - page 103
Download and view the complete annual report
Please find page 103 of the 2006 Singapore Airlines annual report below. You can navigate through the pages in the report by either clicking on the pages listed below, or by using the keyword search tool below to find specific information within the annual report.-
 1
1 -
2
-
3
-
4
-
5
-
6
-
7
-
8
-
9
-
10
-
11
-
12
-
13
-
14
-
15
-
16
-
17
-
18
-
19
-
20
-
21
-
22
-
23
-
24
-
25
-
26
-
27
-
28
-
29
-
30
-
31
-
32
-
33
-
34
-
35
-
36
-
37
-
38
-
39
-
40
-
41
-
42
-
43
-
44
-
45
-
46
-
47
-
48
-
49
-
50
-
51
-
52
-
53
-
54
-
55
-
56
-
57
-
58
-
59
-
60
-
61
-
62
-
63
-
64
-
65
-
66
-
67
-
68
-
69
-
70
-
71
-
72
-
73
-
74
-
75
-
76
-
77
-
78
-
79
-
80
-
81
-
82
-
83
-
84
-
85
-
86
-
87
-
88
-
89
-
90
-
91
-
92
-
 93
93 -
 94
94 -
 95
95 -
 96
96 -
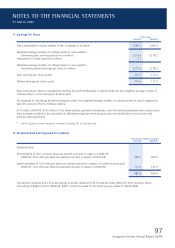
 97
97 -
 98
98 -
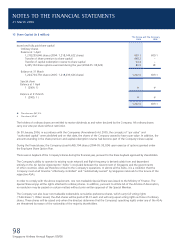
 99
99 -
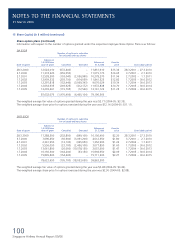
 100
100 -
 101
101 -
 102
102 -
 103
103 -
 104
104 -
 105
105 -
 106
106 -
 107
107 -
 108
108 -
 109
109 -
 110
110 -
 111
111 -
 112
112 -
 113
113 -
114
-
115
-
116
-
117
-
118
-
119
-
120
-
121
-
122
-
123
-
124
-
125
-
126
-
127
-
128
-
129
-
130
-
131
-
132
-
133
-
134
-
135
-
136
-
137
-
138
-
139
-
140
-
141
-
142
-
143
-
144
-
145
-
146
-
147
-
148
-
149
-
150
-
151
-
152
-
153
-
154
-
155
-
156
 |
 |

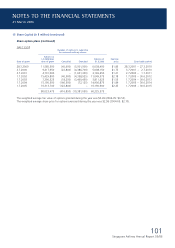
101
Singapore Airlines Annual Report 05/06
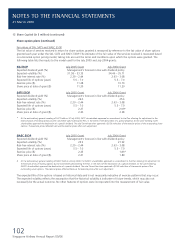
13 Share Capital (in $ million) (continued)
Share option plans (continued)
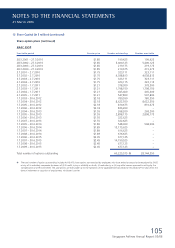
SIAEC ESOP
Number of options to subscribe
for unissued ordinary shares
–––––––––––––––––––––––––––––––––––––––––––––––––––––––––––––––––––––––––
Balance at
1.4.2005/later Balance at Exercise
Date of grant date of grant Cancelled Exercised 31.3.2006 price Exercisable period
––––––––––––––––––––––––––––––––––––––––––––––––––––––––––––––––––––––––––––––––––––––––––––––––––––––––––––––––––––––––––––––––––––––––––––––––
28.3.2000 11,585,500 (45,600) (5,501,500) 6,038,400 $1.85 28.3.2001 – 27.3.2010
3.7.2000 9,417,650 (22,800) (4,386,700) 5,008,150 $1.75 3.7.2001 – 2.7.2010
2.7.2001 4,791,000 – (1,621,350) 3,169,650 $1.21 2.7.2002 – 1.7.2011
1.7.2002 15,429,800 (40,900) (4,338,925) 11,049,975 $2.18 1.7.2003 – 30.6.2012
1.7.2003 7,290,325 (18,250) (3,460,450) 3,811,625 $1.55 1.7.2004 – 30.6.2013
1.7.2004 15,195,500 (166,500) (72,125) 14,956,875 $1.89 1.7.2005 – 30.6.2014
1.7.2005 16,313,700 (122,800) – 16,190,900 $2.45 1.7.2006 – 30.6.2015
–––––––––––––––––––––––––––––––––––––––––––––––––––––––––––––––––––––––––
80,023,475 (416,850) (19,381,050) 60,225,575
–––––––––––––––––––––––––––––––––––––––––––––––––––––––––––––––––––––––––
The weighted average fair value of options granted during the year was $0.49 (2004-05: $0.53).
The weighted average share price for options exercised during the year was $2.58 (2004-05: $2.10).
NOTES TO THE FINANCIAL STATEMENTS
31 March 2006