Singapore Airlines 2006 Annual Report Download - page 58
Download and view the complete annual report
Please find page 58 of the 2006 Singapore Airlines annual report below. You can navigate through the pages in the report by either clicking on the pages listed below, or by using the keyword search tool below to find specific information within the annual report.-
 1
1 -
2
-
3
-
4
-
5
-
6
-
7
-
8
-
9
-
10
-
11
-
12
-
13
-
14
-
15
-
16
-
17
-
18
-
19
-
20
-
21
-
22
-
23
-
24
-
25
-
26
-
27
-
28
-
29
-
30
-
31
-
32
-
33
-
34
-
35
-
36
-
37
-
38
-
39
-
40
-
41
-
42
-
43
-
44
-
45
-
46
-
47
-
 48
48 -
 49
49 -
 50
50 -
 51
51 -
 52
52 -
 53
53 -
 54
54 -
 55
55 -
 56
56 -
 57
57 -
 58
58 -
 59
59 -
 60
60 -
 61
61 -
 62
62 -
 63
63 -
 64
64 -
 65
65 -
 66
66 -
 67
67 -
 68
68 -
69
-
70
-
71
-
72
-
73
-
74
-
75
-
76
-
77
-
78
-
79
-
80
-
81
-
82
-
83
-
84
-
85
-
86
-
87
-
88
-
89
-
90
-
91
-
92
-
93
-
94
-
95
-
96
-
97
-
98
-
99
-
100
-
101
-
102
-
103
-
104
-
105
-
106
-
107
-
108
-
109
-
110
-
111
-
112
-
113
-
114
-
115
-
116
-
117
-
118
-
119
-
120
-
121
-
122
-
123
-
124
-
125
-
126
-
127
-
128
-
129
-
130
-
131
-
132
-
133
-
134
-
135
-
136
-
137
-
138
-
139
-
140
-
141
-
142
-
143
-
144
-
145
-
146
-
147
-
148
-
149
-
150
-
151
-
152
-
153
-
154
-
155
-
156
 |
 |

56
Singapore Airlines Annual Report 05/06
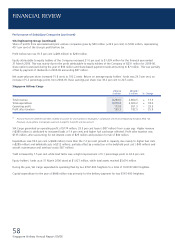
Performance of the Company (continued)
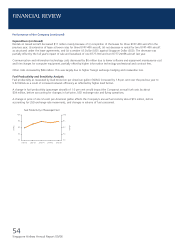
Average Staff Strength and Productivity (continued)
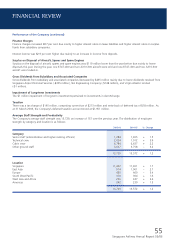
The Company’s average staff productivity rates are shown below:
2005-06 2004-05 % Change
Seat capacity per employee (seat-km) 7,974,630 7,711,634 + 3.4
Passenger load carried per employee (tonne-km) 577,784 549,904 + 5.1
Revenue per employee ($) 750,441 682,294 + 10.0
Value added per employee ($) 258,810 301,024 – 14.0
Issued Share Capital and Share Options
There was no buyback of the Company’s shares during the financial year.
On 1 July 2005, the Company made a seventh grant of share options to employees. Staff accepted 13,293,461 share options to
be exercised between 1 July 2006 and 30 June 2015.
During the year, 6,465,104 share options were exercised by employees. As at 31 March 2006, there were 79,196,566 unexercised
employee share options.
Performance of Subsidiary Companies
There were 25 subsidiary companies in the SIA Group as at 31 March 2006. The major subsidiary companies are Singapore Airport
Terminal Services Limited (SATS), SIA Engineering Company Limited (SIAEC), Singapore Airlines Cargo Private Limited (SIA Cargo),
and SilkAir (Singapore) Private Limited (SilkAir). The following performance review includes intra-group transactions.
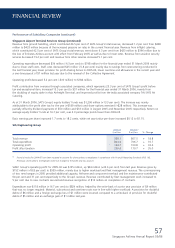
Singapore Airport Terminal Services Group
2005-06 2004-05
R1
$ million $ million % Change
Total revenue 932.0 975.7 – 4.5
Total expenditure 747.9 781.5 – 4.3
Operating profit 184.1 194.2 – 5.2
Profit after taxation 189.2 168.1 + 12.6
R1 Financial results for 2004-05 have been restated to account for share options to employees in compliance with Financial Reporting Standards (FRS) 102.
Previously, share options to employees were not charged to the profit and loss account.
SATS Group’s operating profit decreased $10 million (-5.2 per cent) to $184 million. Profit after tax however increased
$21 million to $189 million mainly because of an increase in share of profits of associated companies of $7 million (after tax)
and the $29 million exceptional item in the previous financial year which arose from the restructuring exercise last year.
SATS Group’s operating revenue for the current financial year was $932 million, a decrease of 4.5 per cent over the last financial
year due primarily to lower rates in the increasingly competitive environment.
FINANCIAL REVIEW