Singapore Airlines 2006 Annual Report Download - page 54
Download and view the complete annual report
Please find page 54 of the 2006 Singapore Airlines annual report below. You can navigate through the pages in the report by either clicking on the pages listed below, or by using the keyword search tool below to find specific information within the annual report.-
 1
1 -
2
-
3
-
4
-
5
-
6
-
7
-
8
-
9
-
10
-
11
-
12
-
13
-
14
-
15
-
16
-
17
-
18
-
19
-
20
-
21
-
22
-
23
-
24
-
25
-
26
-
27
-
28
-
29
-
30
-
31
-
32
-
33
-
34
-
35
-
36
-
37
-
38
-
39
-
40
-
41
-
42
-
43
-
 44
44 -
 45
45 -
 46
46 -
 47
47 -
 48
48 -
 49
49 -
 50
50 -
 51
51 -
 52
52 -
 53
53 -
 54
54 -
 55
55 -
 56
56 -
 57
57 -
 58
58 -
 59
59 -
 60
60 -
 61
61 -
 62
62 -
 63
63 -
 64
64 -
65
-
66
-
67
-
68
-
69
-
70
-
71
-
72
-
73
-
74
-
75
-
76
-
77
-
78
-
79
-
80
-
81
-
82
-
83
-
84
-
85
-
86
-
87
-
88
-
89
-
90
-
91
-
92
-
93
-
94
-
95
-
96
-
97
-
98
-
99
-
100
-
101
-
102
-
103
-
104
-
105
-
106
-
107
-
108
-
109
-
110
-
111
-
112
-
113
-
114
-
115
-
116
-
117
-
118
-
119
-
120
-
121
-
122
-
123
-
124
-
125
-
126
-
127
-
128
-
129
-
130
-
131
-
132
-
133
-
134
-
135
-
136
-
137
-
138
-
139
-
140
-
141
-
142
-
143
-
144
-
145
-
146
-
147
-
148
-
149
-
150
-
151
-
152
-
153
-
154
-
155
-
156
 |
 |

52
Singapore Airlines Annual Report 05/06
Performance of the Company (continued)
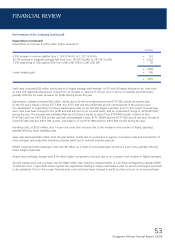
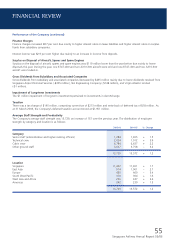
Expenditure
The Company’s expenditure for 2005-06 increased 12.7 per cent from a year ago, to $9,652 million as follows:
2005-06 2004-05 R1 Change
$ million % $ million % $ million %
Fuel cost 3,368.1 34.9 2,148.1 25.1 + 1,220.0 + 56.8
Staff costs 1,570.4 16.3 1,551.9 18.1 + 18.5 + 1.2
Depreciation R2 959.4 9.9 903.5 10.6 + 55.9 + 6.2
Handling charges 732.9 7.6 721.4 8.4 + 11.5 + 1.6
Sales costs R3 643.4 6.7 669.1 7.8 - 25.7 - 3.8
Inflight meals and other
passenger costs 556.3 5.8 548.0 6.4 + 8.3 + 1.5
Airport and overflying charges 520.4 5.4 506.3 5.9 + 14.1 + 2.8
Aircraft maintenance and
overhaul costs 453.4 4.7 733.4 8.6 – 280.0 – 38.2
Rentals on leased aircraft 296.6 3.0 307.5 3.6 – 10.9 – 3.5
Communication and information
technology costs R4 115.0 1.2 120.8 1.4 – 5.8 – 4.8
Other costs R5 435.9 4.5 352.2 4.1 + 83.7 + 23.8
9,651.8 100.0 8,562.2 100.0 + 1,089.6 + 12.7
R1 Financial results for 2004-05 have been restated to account for share options to employees in compliance with Financial Reporting Standard (FRS) 102. Previously,
share options to employees were not charged to the profit and loss account.
R2 Depreciation included impairment of fixed assets and amortisation of intangible assets (application software).
R3 Sales costs included commissions and incentives payable, frequent flyer programme costs, computer reservation system booking fees, advertising expenses and
other sales costs.
R4 Communication and information technology costs were for data transmission and contract service fees, hire of computer equipment, maintenance/rental of
software, and information technology contract and professional fees.
R5 Other costs mainly comprised crew expenses, company accommodation costs, foreign exchange hedging and revaluation loss, comprehensive aviation insurance
costs, airport lounge expenses, non-information technology contract and professional fees, expenses incurred to mount non-scheduled services, aircraft licence
fees and recoveries.
A breakdown of fuel cost is shown below:
2005-06 2004-05 Change
$ million $ million $ million
Fuel cost (before hedging) 3,535 2,451 + 1,084
Fuel hedging gain (167) (303) + 136
Fuel cost (net) 3,368 2,148 + 1,220
FINANCIAL REVIEW