Singapore Airlines 2006 Annual Report Download - page 4
Download and view the complete annual report
Please find page 4 of the 2006 Singapore Airlines annual report below. You can navigate through the pages in the report by either clicking on the pages listed below, or by using the keyword search tool below to find specific information within the annual report.-
 1
1 -
 2
2 -
 3
3 -
 4
4 -
 5
5 -
 6
6 -
 7
7 -
 8
8 -
 9
9 -
 10
10 -
 11
11 -
 12
12 -
 13
13 -
 14
14 -
 15
15 -
16
-
17
-
18
-
19
-
20
-
21
-
22
-
23
-
24
-
25
-
26
-
27
-
28
-
29
-
30
-
31
-
32
-
33
-
34
-
35
-
36
-
37
-
38
-
39
-
40
-
41
-
42
-
43
-
44
-
45
-
46
-
47
-
48
-
49
-
50
-
51
-
52
-
53
-
54
-
55
-
56
-
57
-
58
-
59
-
60
-
61
-
62
-
63
-
64
-
65
-
66
-
67
-
68
-
69
-
70
-
71
-
72
-
73
-
74
-
75
-
76
-
77
-
78
-
79
-
80
-
81
-
82
-
83
-
84
-
85
-
86
-
87
-
88
-
89
-
90
-
91
-
92
-
93
-
94
-
95
-
96
-
97
-
98
-
99
-
100
-
101
-
102
-
103
-
104
-
105
-
106
-
107
-
108
-
109
-
110
-
111
-
112
-
113
-
114
-
115
-
116
-
117
-
118
-
119
-
120
-
121
-
122
-
123
-
124
-
125
-
126
-
127
-
128
-
129
-
130
-
131
-
132
-
133
-
134
-
135
-
136
-
137
-
138
-
139
-
140
-
141
-
142
-
143
-
144
-
145
-
146
-
147
-
148
-
149
-
150
-
151
-
152
-
153
-
154
-
155
-
156
 |
 |

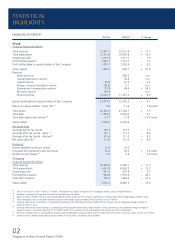
FINANCIAL STATISTICS
R1
2005-06 2004-05
R2 % Change
Group
Financial Results ($ million)
Total revenue 13,341.1 12,012.9 + 11.1
Total expenditure 12,127.8 10,695.8 + 13.4
Operating profi t 1,213.3 1,317.1 – 7.9
Profi t before taxation 1,662.1 1,791.0 – 7.2
Profi t attributable to equity holders of the Company 1,240.7 1,352.4 – 8.3
Share capital 1,202.6 609.1 + 97.4
Reserves
Share premium – 448.2 n.m.
Capital redemption reserve – 64.4 n.m.
Capital reserve 40.8 41.9 – 2.6
Foreign currency translation reserve (30.5) 3.1 n.m.
Share-based compensation reserve 81.8 48.4 + 69.0
Fair value reserve 163.6 – n.m.
General reserve 12,012.3 11,127.2 + 8.0
Equity attributable to equity holders of the Company 13,470.6 12,342.3 + 9.1
Return on equity holders’ funds (%) R3 9.6 11.4 – 1.8 points
Total assets 23,369.5 21,744.7 + 7.5
Total debt 2,305.6 2,403.0 – 4.1
Total debt equity ratio (times) R4 0.17 0.19 – 0.02 times
Value added 5,534.0 5,533.6 –
Per Share Data
Earnings before tax (cents) 136.3 147.0 – 7.3
Earnings after tax (cents) - basic R5 101.7 111.0 – 8.4
Earnings after tax (cents) - diluted R6 101.6 111.0 – 8.5
Net asset value ($) R7 11.00 10.13 + 8.6
Dividends
Interim dividend (cents per share) 10.0 10.0 –
Proposed fi nal dividend (cents per share) 35.0 30.0 + 5.0 cents
Dividend cover (times) R8 2.3 2.8 – 0.5 times
Company
Financial Results ($ million)
Total revenue 10,302.8 9,260.1 + 11.3
Total expenditure 9,651.8 8,562.2 + 12.7
Operating profi t 651.0 697.9 – 6.7
Profi t before taxation 940.8 1,570.4 – 40.1
Profi t after taxation 746.0 1,283.6 – 41.9
Value added 3,553.2 4,085.5 – 13.0
R1 SIA’s fi nancial year is from 1 April to 31 March. Throughout this report, all fi gures are in Singapore Dollars, unless stated otherwise.
R2 Restated to comply with new and revised Financial Reporting Standards.
R3 Return on equity holders’ funds is profi t attributable to equity holders of the Company expressed as a percentage of the average equity holders’ funds.
R4 Total debt equity ratio is total debt divided by equity attributable to equity holders of the Company as at 31 March.
R5 Earnings after tax per share (basic) is computed by dividing profi t attributable to equity holders of the Company by the weighted average number of
ordinary shares in issue.
R6 Earnings after tax per share (diluted) is computed by dividing profi t attributable to equity holders of the Company by the weighted average number of
ordinary shares in issue after adjusting for the dilutive effect on the exercise of all outstanding share options granted to employees.
R7 Net asset value per share is computed by dividing equity attributable to equity holders of the Company by the number of ordinary shares in issue at 31 March.
R8 Dividend cover is profi t attributable to equity holders of the Company divided by total dividend.
02
Singapore Airlines Annual Report 05/06
STATISTICAL
HIGHLIGHTS