Singapore Airlines 2006 Annual Report Download - page 76
Download and view the complete annual report
Please find page 76 of the 2006 Singapore Airlines annual report below. You can navigate through the pages in the report by either clicking on the pages listed below, or by using the keyword search tool below to find specific information within the annual report.-
 1
1 -
2
-
3
-
4
-
5
-
6
-
7
-
8
-
9
-
10
-
11
-
12
-
13
-
14
-
15
-
16
-
17
-
18
-
19
-
20
-
21
-
22
-
23
-
24
-
25
-
26
-
27
-
28
-
29
-
30
-
31
-
32
-
33
-
34
-
35
-
36
-
37
-
38
-
39
-
40
-
41
-
42
-
43
-
44
-
45
-
46
-
47
-
48
-
49
-
50
-
51
-
52
-
53
-
54
-
55
-
56
-
57
-
58
-
59
-
60
-
61
-
62
-
63
-
64
-
65
-
 66
66 -
 67
67 -
 68
68 -
 69
69 -
 70
70 -
 71
71 -
 72
72 -
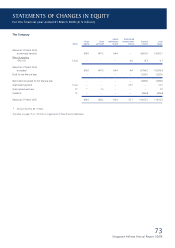
 73
73 -
 74
74 -
 75
75 -
 76
76 -
 77
77 -
 78
78 -
 79
79 -
 80
80 -
 81
81 -
 82
82 -
 83
83 -
 84
84 -
 85
85 -
 86
86 -
87
-
88
-
89
-
90
-
91
-
92
-
93
-
94
-
95
-
96
-
97
-
98
-
99
-
100
-
101
-
102
-
103
-
104
-
105
-
106
-
107
-
108
-
109
-
110
-
111
-
112
-
113
-
114
-
115
-
116
-
117
-
118
-
119
-
120
-
121
-
122
-
123
-
124
-
125
-
126
-
127
-
128
-
129
-
130
-
131
-
132
-
133
-
134
-
135
-
136
-
137
-
138
-
139
-
140
-
141
-
142
-
143
-
144
-
145
-
146
-
147
-
148
-
149
-
150
-
151
-
152
-
153
-
154
-
155
-
156
 |
 |

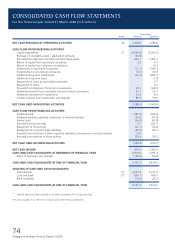
74
Singapore Airlines Annual Report 05/06
The Group
Notes 2005-06 2004-05
R1
NET CASH PROVIDED BY OPERATING ACTIVITIES 30 2,309.6 2,786.6
CASH FLOW FROM INVESTING ACTIVITIES
Capital expenditure 31 (2,058.8) (2,095.2)
Purchase of intangible assets – application software (32.4) –
Proceeds from disposal of aircraft and other fi xed assets 629.7 1,081.2
Return of capital from associated companies 3.3 3.3
Return of capital from long-term investments – 13.9
Investments in associated companies (27.1) (184.1)
Investments in joint venture companies (8.2) (10.7)
Additional long-term investments (91.6) (285.7)
Additional long-term loans – (1.4)
Repayment of loans by associated companies – 0.7
Repayment of loans – 4.1
Proceeds from disposal of long-term investments 90.5 349.9
Dividends received from associated and joint venture companies 91.2 55.7
Dividends received from investments 25.4 8.4
Interest received from investments and deposits 89.5 50.0
NET CASH USED IN INVESTING ACTIVITIES (1,288.5) (1,009.9)
CASH FLOW FROM FINANCING ACTIVITIES
Dividends paid (487.6) (426.4)
Dividends paid by subsidiary companies to minority interests (30.9) (91.8)
Interest paid (90.4) (67.8)
Proceeds from borrowings 0.5 202.5
Repayment of borrowings (25.1) (24.4)
Repayment of long-term lease liabilities (59.3) (46.1)
Proceeds from issuance of share capital by subsidiary companies to minority interests 12.0 –
Proceeds from exercise of share options 135.9 59.3
NET CASH USED IN FINANCING ACTIVITIES (544.9) (394.7)
NET CASH INFLOW 476.2 1,382.0
CASH AND CASH EQUIVALENTS AT BEGINNING OF FINANCIAL YEAR 2,814.0 1,491.4
Effect of exchange rate changes (149.0) (59.4)
CASH AND CASH EQUIVALENTS AT END OF FINANCIAL YEAR 3,141.2 2,814.0
ANALYSIS OF CASH AND CASH EQUIVALENTS
Fixed deposits 27 2,451.9 2,231.9
Cash and bank 27 699.7 608.3
Bank overdrafts (10.4) (26.2)
CASH AND CASH EQUIVALENTS AT END OF FINANCIAL YEAR 3,141.2 2,814.0
R1 2004-05 fi gures have been restated for the effect of adopting FRS 102 [see Note 3(d)].
The notes on pages 75 to 135 form an integral part of these fi nancial statements.
CONSOLIDATED CASH FLOW STATEMENTS
For the financial year ended 31 March 2006 (in $ million)