Singapore Airlines 2006 Annual Report Download - page 105
Download and view the complete annual report
Please find page 105 of the 2006 Singapore Airlines annual report below. You can navigate through the pages in the report by either clicking on the pages listed below, or by using the keyword search tool below to find specific information within the annual report.-
 1
1 -
2
-
3
-
4
-
5
-
6
-
7
-
8
-
9
-
10
-
11
-
12
-
13
-
14
-
15
-
16
-
17
-
18
-
19
-
20
-
21
-
22
-
23
-
24
-
25
-
26
-
27
-
28
-
29
-
30
-
31
-
32
-
33
-
34
-
35
-
36
-
37
-
38
-
39
-
40
-
41
-
42
-
43
-
44
-
45
-
46
-
47
-
48
-
49
-
50
-
51
-
52
-
53
-
54
-
55
-
56
-
57
-
58
-
59
-
60
-
61
-
62
-
63
-
64
-
65
-
66
-
67
-
68
-
69
-
70
-
71
-
72
-
73
-
74
-
75
-
76
-
77
-
78
-
79
-
80
-
81
-
82
-
83
-
84
-
85
-
86
-
87
-
88
-
89
-
90
-
91
-
92
-
93
-
94
-
 95
95 -
 96
96 -
 97
97 -
 98
98 -
 99
99 -
 100
100 -
 101
101 -
 102
102 -
 103
103 -
 104
104 -
 105
105 -
 106
106 -
 107
107 -
 108
108 -
 109
109 -
 110
110 -
 111
111 -
 112
112 -
 113
113 -
 114
114 -
 115
115 -
116
-
117
-
118
-
119
-
120
-
121
-
122
-
123
-
124
-
125
-
126
-
127
-
128
-
129
-
130
-
131
-
132
-
133
-
134
-
135
-
136
-
137
-
138
-
139
-
140
-
141
-
142
-
143
-
144
-
145
-
146
-
147
-
148
-
149
-
150
-
151
-
152
-
153
-
154
-
155
-
156
 |
 |

103
Singapore Airlines Annual Report 05/06
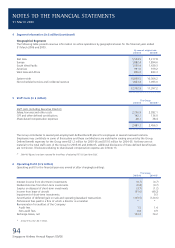
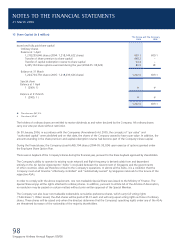
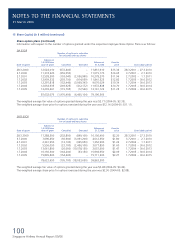
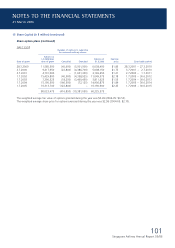
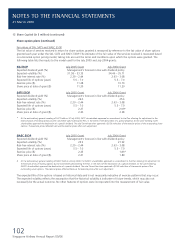
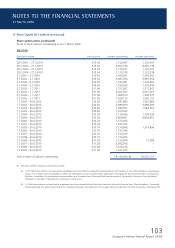
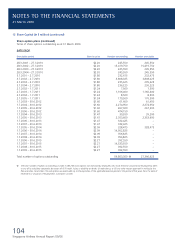
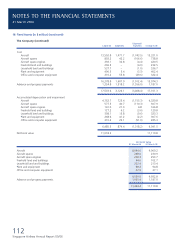
13 Share Capital (in $ million) (continued)
Share option plans (continued)
Terms of share options outstanding as at 31 March 2006:
SIA ESOP
Exercisable period Exercise price Number outstanding Number exercisable
28.3.2001 – 27.3.2010 $15.34 1,152,997 1,152,997
28.3.2002 – 27.3.2010 $15.34 8,450,138 8,450,138
28.3.2003 – 27.3.2010 $15.34 1,125,237 1,125,237
28.3.2004 – 27.3.2010 $15.34 1,123,238 1,123,238
3.7.2001 – 2.7.2010 $16.65 1,359,341 1,359,341
3.7.2002 – 2.7.2010 $16.65 6,987,054 6,987,054
3.7.2003 – 2.7.2010 $16.65 1,334,381 1,334,381
3.7.2004 – 2.7.2010 $16.65 1,334,394 1,334,394
2.7.2002 – 1.7.2011 $11.96 1,371,667 1,371,667
2.7.2003 – 1.7.2011 $11.96 6,067,507 6,067,507
2.7.2004 – 1.7.2011 $11.96 1,408,973 1,408,973
2.7.2005 – 1.7.2011 $11.96 1,430,123 1,430,123
1.7.2003 – 30.6.2012 $12.82 1,587,884 1,587,884
1.7.2004 – 30.6.2012 $12.82 6,989,699 6,989,699
1.7.2005 – 30.6.2012 $12.82 1,584,507 1,584,507
1.7.2006 – 30.6.2012 $12.82 1,679,433 –
1.7.2004 – 30.6.2013 $10.34 1,124,034 1,124,034
1.7.2005 – 30.6.2013 $10.34 4,804,807 4,804,807
1.7.2006 – 30.6.2013 $10.34 1,573,436 –
1.7.2007 – 30.6.2013 $10.34 1,573,752 –
1.7.2005 – 30.6.2014 $10.70 1,214,896 1,214,896
1.7.2006 – 30.6.2014 $10.70 7,737,548 –
1.7.2007 – 30.6.2014 $10.70 1,510,039 –
1.7.2008 – 30.6.2014 $10.70 1,510,355 –
1.7.2006 – 30.6.2015 $11.28 1,723,908 21,280
1.7.2007 – 30.6.2015 $11.28 8,092,606 –
1.7.2008 – 30.6.2015 $11.28 1,672,142 –
1.7.2009 – 30.6.2015 $11.28 1,672,470 –
Total number of options outstanding 79,196,566 @ 50,472,157
@ The total number of options outstanding includes:
(a) 10,713,029 share options not exercised by employees who have retired or ceased to be employed by the Company or any of the subsidiary companies by
reason of (i) ill health, injury or disability or death; (ii) redundancy; or (iii) any other reason approved in writing by the Board Compensation and Industrial
Relations Committee. The said options are exercisable up to the expiration of the applicable exercise period or the period of fi ve years from the date of
retirement or cessation of employment, whichever is earlier; and
(b) 175,265 share options not exercised by employees who have completed their fi xed term contracts during the fi nancial year. The said options, if unvested,
shall immediately vest and be exercisable from the date of cessation of employment to the date falling one year from the date of cessation of employment.
NOTES TO THE FINANCIAL STATEMENTS
31 March 2006