Singapore Airlines 2006 Annual Report Download - page 140
Download and view the complete annual report
Please find page 140 of the 2006 Singapore Airlines annual report below. You can navigate through the pages in the report by either clicking on the pages listed below, or by using the keyword search tool below to find specific information within the annual report.-
 1
1 -
2
-
3
-
4
-
5
-
6
-
7
-
8
-
9
-
10
-
11
-
12
-
13
-
14
-
15
-
16
-
17
-
18
-
19
-
20
-
21
-
22
-
23
-
24
-
25
-
26
-
27
-
28
-
29
-
30
-
31
-
32
-
33
-
34
-
35
-
36
-
37
-
38
-
39
-
40
-
41
-
42
-
43
-
44
-
45
-
46
-
47
-
48
-
49
-
50
-
51
-
52
-
53
-
54
-
55
-
56
-
57
-
58
-
59
-
60
-
61
-
62
-
63
-
64
-
65
-
66
-
67
-
68
-
69
-
70
-
71
-
72
-
73
-
74
-
75
-
76
-
77
-
78
-
79
-
80
-
81
-
82
-
83
-
84
-
85
-
86
-
87
-
88
-
89
-
90
-
91
-
92
-
93
-
94
-
95
-
96
-
97
-
98
-
99
-
100
-
101
-
102
-
103
-
104
-
105
-
106
-
107
-
108
-
109
-
110
-
111
-
112
-
113
-
114
-
115
-
116
-
117
-
118
-
119
-
120
-
121
-
122
-
123
-
124
-
125
-
126
-
127
-
128
-
129
-
 130
130 -
 131
131 -
 132
132 -
 133
133 -
 134
134 -
 135
135 -
 136
136 -
 137
137 -
 138
138 -
 139
139 -
 140
140 -
 141
141 -
 142
142 -
 143
143 -
 144
144 -
 145
145 -
 146
146 -
 147
147 -
 148
148 -
 149
149 -
 150
150 -
151
-
152
-
153
-
154
-
155
-
156
 |
 |

138
Singapore Airlines Annual Report 05/06
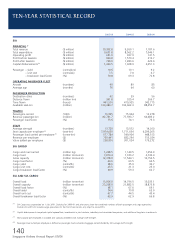
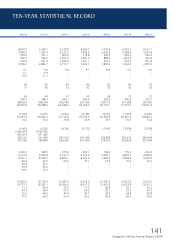
FIVE-YEAR FINANCIAL SUMMARY OF THE GROUP
2005-06 2004-05 2003-04 2002-03 2001-02
PROFIT AND LOSS ACCOUNT ($ million)
Total revenue 13,341.1 12,012.9 9,761.9 10,515.0 9,382.8
Total expenditure (12,127.8) (10,695.8) (9,093.0) (9,797.9) (8,458.2)
Operating profit 1,213.3 1,317.1 668.9 717.1 924.6
Finance charges (96.3) (77.5) (65.1) (54.7) (44.0)
Interest income 96.7 52.7 32.5 33.7 52.0
Surplus on disposal of aircraft, spares and spare engines 115.7 215.2 102.7 144.9 66.0
Surplus on disposal of other fixed assets 11.9 8.7 5.5 1.2 2.9
Dividend from long-term investments, gross 24.6 8.0 3.6 5.2 5.7
Impairment of long-term investments (1.0) (0.1) (1.8) (9.4) (1.1)
Surplus on disposal of long-term investments – – – – 4.4
Amortisation of goodwill on consolidation – (0.1) (0.1) – –
Amortisation of deferred gain 1.4 1.3 1.6 – –
Share of profits of joint venture companies 40.6 12.5 6.4 14.5 20.5
Share of profits/(losses) of associated companies 255.2 203.7 (39.0) 123.8 (71.3)
Profit before exceptional items 1,662.1 1,741.5 715.2 976.3 959.7
Surplus on sale of investment in Air New Zealand Limited – 45.7 – – –
Surplus on sale of investment in Raffles Holdings Ltd – 32.6 – – –
Surplus on sale of investment in Taikoo – 9.0 – – –
Surplus on liquidation of Abacus Distribution
Systems Pte Ltd – – 9.2 – –
Surplus on disposal of Aviation Software
Development Consultancy India Limited – – 1.1 – –
Staff compensation and restructuring of operations – (37.8) (41.4) – –
Surplus on liquidation of Asian Frequent Flyer Pte Ltd – – – 0.5 –
Surplus on sale of long-term investments – – – – 30.2
Provision for diminution in value of investment in
Air New Zealand Limited – – – – (266.9)
Recognition of deferred gain on divestment of 51%
equity interests in Eagle Services Asia Private Limited – – – – 202.6
Profit before taxation 1,662.1 1,791.0 684.1 976.8 925.6
Profit attributable to equity holders of the Company 1,240.7 1,352.4 750.0 1,064.8 631.7
BALANCE SHEET ($ million)
Share capital 1,202.6 609.1 609.1 609.1 609.1
Reserves
Share premium – 448.2 447.2 447.2 447.2
Capital redemption reserve – 64.4 64.4 64.4 64.4
Capital reserve 40.8 41.9 32.0 7.7 6.9
Foreign currency translation reserve (30.5) 3.1 19.8 41.3 63.8
Share-based compensation reserve 81.8 48.4 11.5 – –
Fair value reserve 163.6 – – – –
General reserve 12,012.3 11,127.2 10,183.3 9,539.1 8,655.2
Equity attributable to equity holders of the Company 13,470.6 12,342.3 11,367.3 10,708.8 9,846.6
Minority interests 396.3 302.8 304.1 267.5 228.7
Deferred account 349.6 414.6 446.7 523.1 591.9
Deferred taxation 2,486.1 2,450.1 2,175.3 2,251.0 2,664.5
Fixed assets 15,524.7 15,161.7 15,222.9 15,406.0 14,442.9
Intangible assets R1 121.7 144.1 1.4 1.5 –
Associated companies 996.3 695.1 429.7 500.7 385.5
Joint venture companies 362.6 323.6 309.2 296.4 277.1
Long-term investments 425.9 476.3 475.2 569.6 590.4
Current assets 5,938.3 4,943.9 3,463.8 2,409.8 2,884.5
Total assets 23,369.5 21,744.7 19,902.2 19,184.0 18,580.4
Long-term liabilities 1,824.4 2,333.3 2,207.2 1,879.6 1,928.9
Current liabilities 4,842.5 3,901.6 3,401.6 3,554.0 3,319.8
Total liabilities 6,666.9 6,234.9 5,608.8 5,433.6 5,248.7
R1 In accordance with the revised FRS 38: Intangible Assets, the Group has reclassified the net book value of computer software from fixed assets to
intangible assets for 2004-05. The comparatives for 2001-02 to 2003-04 have not been restated.