Singapore Airlines 2006 Annual Report Download - page 150
Download and view the complete annual report
Please find page 150 of the 2006 Singapore Airlines annual report below. You can navigate through the pages in the report by either clicking on the pages listed below, or by using the keyword search tool below to find specific information within the annual report.-
 1
1 -
2
-
3
-
4
-
5
-
6
-
7
-
8
-
9
-
10
-
11
-
12
-
13
-
14
-
15
-
16
-
17
-
18
-
19
-
20
-
21
-
22
-
23
-
24
-
25
-
26
-
27
-
28
-
29
-
30
-
31
-
32
-
33
-
34
-
35
-
36
-
37
-
38
-
39
-
40
-
41
-
42
-
43
-
44
-
45
-
46
-
47
-
48
-
49
-
50
-
51
-
52
-
53
-
54
-
55
-
56
-
57
-
58
-
59
-
60
-
61
-
62
-
63
-
64
-
65
-
66
-
67
-
68
-
69
-
70
-
71
-
72
-
73
-
74
-
75
-
76
-
77
-
78
-
79
-
80
-
81
-
82
-
83
-
84
-
85
-
86
-
87
-
88
-
89
-
90
-
91
-
92
-
93
-
94
-
95
-
96
-
97
-
98
-
99
-
100
-
101
-
102
-
103
-
104
-
105
-
106
-
107
-
108
-
109
-
110
-
111
-
112
-
113
-
114
-
115
-
116
-
117
-
118
-
119
-
120
-
121
-
122
-
123
-
124
-
125
-
126
-
127
-
128
-
129
-
130
-
131
-
132
-
133
-
134
-
135
-
136
-
137
-
138
-
139
-
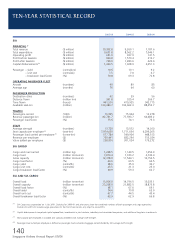
 140
140 -
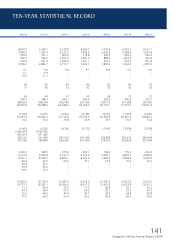
 141
141 -
 142
142 -
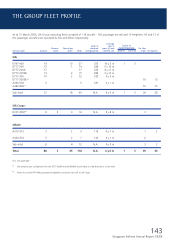
 143
143 -
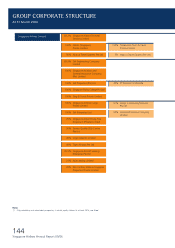
 144
144 -
 145
145 -
 146
146 -
 147
147 -
 148
148 -
 149
149 -
 150
150 -
 151
151 -
 152
152 -
 153
153 -
 154
154 -
 155
155 -
 156
156
 |
 |
148
Singapore Airlines Annual Report 05/06
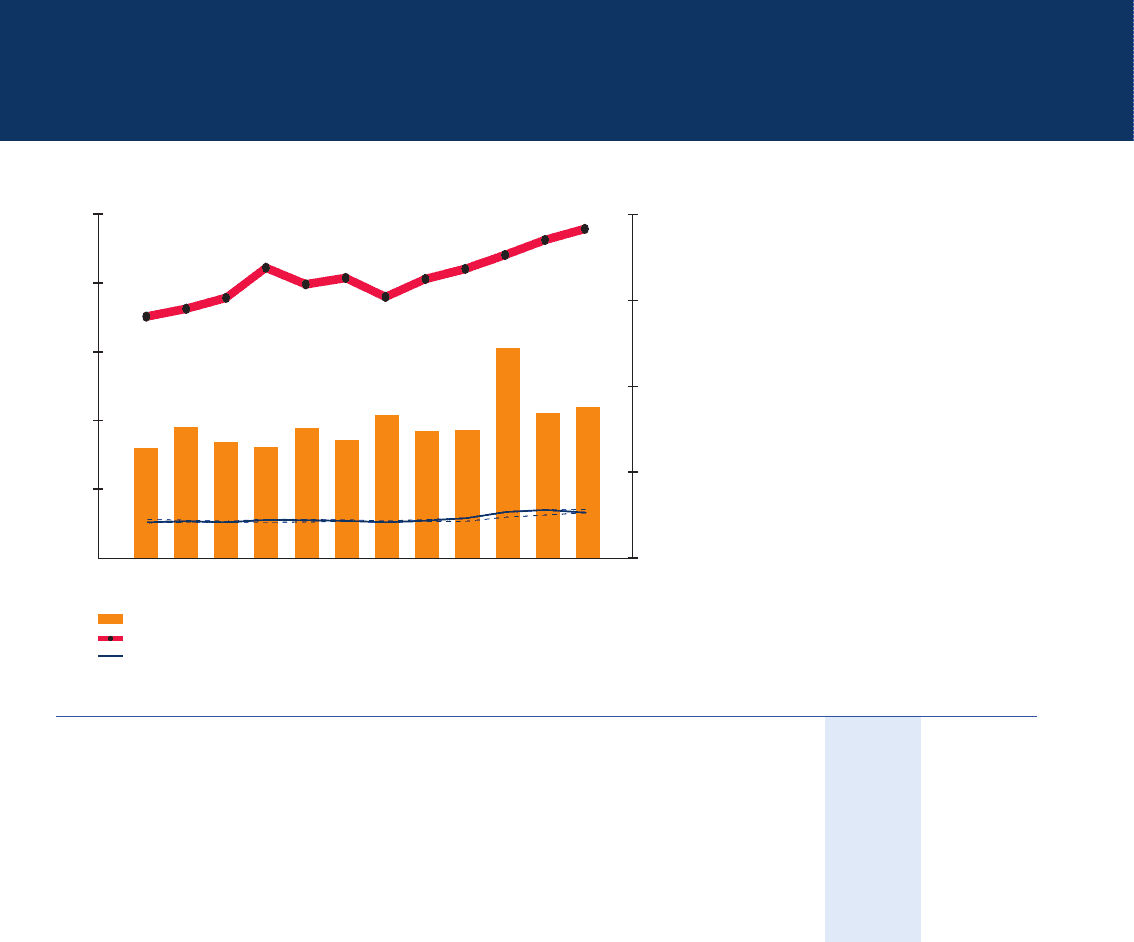
SIA Share Price and Turnover
Index
Apr May Jun Jul Aug Sep Oct Nov Dec Jan Feb Mar
05 05 05 05 05 05 05 05 05 06 06 06
100
80
60
40
20
0
High
Low
Share Price ($)
Volume (Million Stock Units)
Turnover
ST Index
Closing Price
2,600
2,200
1,800
1,400
1,000
SHARE PRICE AND TURNOVER
As at 31 March 2006
2005-06 2004-05
Share Price ($)
Highest closing price 14.90 12.70
Lowest closing price 11.10 9.40
31 March closing price 14.00 11.90
Market Value Ratios R1
Price/Earnings 13.77 10.72
Price/Book value 1.27 1.17
Price/Cash earnings R2 6.73 5.67
R1 Based on closing price on 31 March and Group numbers.
R2 Cash earnings is defined as profit attributable to equity holders of the Company plus depreciation and amortisation.