Singapore Airlines 2006 Annual Report Download - page 144
Download and view the complete annual report
Please find page 144 of the 2006 Singapore Airlines annual report below. You can navigate through the pages in the report by either clicking on the pages listed below, or by using the keyword search tool below to find specific information within the annual report.-
 1
1 -
2
-
3
-
4
-
5
-
6
-
7
-
8
-
9
-
10
-
11
-
12
-
13
-
14
-
15
-
16
-
17
-
18
-
19
-
20
-
21
-
22
-
23
-
24
-
25
-
26
-
27
-
28
-
29
-
30
-
31
-
32
-
33
-
34
-
35
-
36
-
37
-
38
-
39
-
40
-
41
-
42
-
43
-
44
-
45
-
46
-
47
-
48
-
49
-
50
-
51
-
52
-
53
-
54
-
55
-
56
-
57
-
58
-
59
-
60
-
61
-
62
-
63
-
64
-
65
-
66
-
67
-
68
-
69
-
70
-
71
-
72
-
73
-
74
-
75
-
76
-
77
-
78
-
79
-
80
-
81
-
82
-
83
-
84
-
85
-
86
-
87
-
88
-
89
-
90
-
91
-
92
-
93
-
94
-
95
-
96
-
97
-
98
-
99
-
100
-
101
-
102
-
103
-
104
-
105
-
106
-
107
-
108
-
109
-
110
-
111
-
112
-
113
-
114
-
115
-
116
-
117
-
118
-
119
-
120
-
121
-
122
-
123
-
124
-
125
-
126
-
127
-
128
-
129
-
130
-
131
-
132
-
133
-
 134
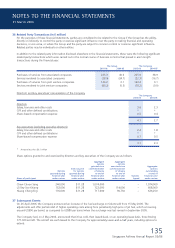
134 -
 135
135 -
 136
136 -
 137
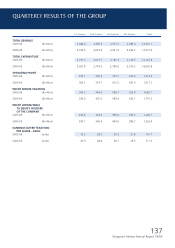
137 -
 138
138 -
 139
139 -
 140
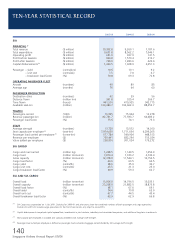
140 -
 141
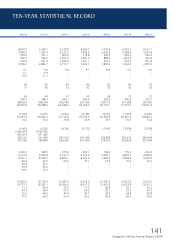
141 -
 142
142 -
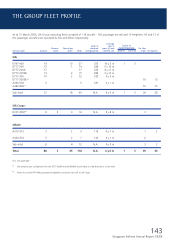
 143
143 -
 144
144 -
 145
145 -
 146
146 -
 147
147 -
 148
148 -
 149
149 -
 150
150 -
 151
151 -
 152
152 -
 153
153 -
 154
154 -
155
-
156
 |
 |

142
Singapore Airlines Annual Report 05/06
TEN-YEAR CHARTS
12,000
10,000
8,000
6,000
4,000
2,000
$ Million
$ Million
96 97 98 99 00 01 02 03 04 05
97 98 99 00 01 02 03 04 05 06
Revenue
Expenditure
12,000
10,000
8,000
6,000
4,000
2,000
2,000
1,500
1,000
500
0
$ Million
$ Million
96 97 98 99 00 01 02 03 04 05
97 98 99 00 01 02 03 04 05 06
Profit After Taxation
Profit Before Taxation
2,000
1,500
1,000
500
0
10,000
8,000
6,000
4,000
2,000
0
SIA and SIA Cargo Passenger
and Cargo Load
Cargo Tonne-km (Million)
Revenue Passenger-km (Million)
96 97 98 99 00 01 02 03 04 05
97 98 99 00 01 02 03 04 05 06
Revenue Passenger-km
Cargo Tonne-km
100,000
80,000
60,000
40,000
20,000
0
1,500
1,200
900
600
300
0
SIA and SIA Cargo Passenger
and Cargo Carried
Cargo Tonne (’000)
Passenger Number (’000)
96 97 98 99 00 01 02 03 04 05
97 98 99 00 01 02 03 04 05 06
Passenger Number
Cargo Tonne
18,000
16,000
14,000
12,000
10,000
8,000
Average Operating Fleet Age:
SIA and Industry Wide
Age (Months)
Age (Months)
97 98 99 00 01 02 03 04 05 06
31 March
Industrial Wide R2
SIA
180
150
120
90
60
30
0
180
150
120
90
60
30
0
Average age of SIA passenger fl eet: 6 years 4 months
(as at 31 Mar 2006).
R1 SIA Cargo was corporatised on 1 July 2001. Company revenue, expenditure, profit before and after taxation in these charts for 2000-01 and prior years
show the combined results of both passenger and cargo operations. The numbers for 2001-02 include cargo operations for the first three months only
(April to June 2001).
R2 Source: Avsoft Information Systems, Ruby, England.