Singapore Airlines 2006 Annual Report Download - page 66
Download and view the complete annual report
Please find page 66 of the 2006 Singapore Airlines annual report below. You can navigate through the pages in the report by either clicking on the pages listed below, or by using the keyword search tool below to find specific information within the annual report.-
 1
1 -
2
-
3
-
4
-
5
-
6
-
7
-
8
-
9
-
10
-
11
-
12
-
13
-
14
-
15
-
16
-
17
-
18
-
19
-
20
-
21
-
22
-
23
-
24
-
25
-
26
-
27
-
28
-
29
-
30
-
31
-
32
-
33
-
34
-
35
-
36
-
37
-
38
-
39
-
40
-
41
-
42
-
43
-
44
-
45
-
46
-
47
-
48
-
49
-
50
-
51
-
52
-
53
-
54
-
55
-
 56
56 -
 57
57 -
 58
58 -
 59
59 -
 60
60 -
 61
61 -
 62
62 -
 63
63 -
 64
64 -
 65
65 -
 66
66 -
 67
67 -
 68
68 -
 69
69 -
 70
70 -
 71
71 -
 72
72 -
 73
73 -
 74
74 -
 75
75 -
 76
76 -
77
-
78
-
79
-
80
-
81
-
82
-
83
-
84
-
85
-
86
-
87
-
88
-
89
-
90
-
91
-
92
-
93
-
94
-
95
-
96
-
97
-
98
-
99
-
100
-
101
-
102
-
103
-
104
-
105
-
106
-
107
-
108
-
109
-
110
-
111
-
112
-
113
-
114
-
115
-
116
-
117
-
118
-
119
-
120
-
121
-
122
-
123
-
124
-
125
-
126
-
127
-
128
-
129
-
130
-
131
-
132
-
133
-
134
-
135
-
136
-
137
-
138
-
139
-
140
-
141
-
142
-
143
-
144
-
145
-
146
-
147
-
148
-
149
-
150
-
151
-
152
-
153
-
154
-
155
-
156
 |
 |

64
Singapore Airlines Annual Report 05/06
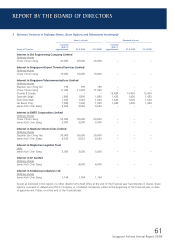
5 Options on Shares in the Company (continued)
(a) Singapore Airport Terminal Services Limited (“SATS”) (continued)
At the end of the fi nancial year, options to take up 59,863,300 unissued shares in SATS were outstanding:
Number of options to subscribe
for unissued ordinary shares
–––––––––––––––––––––––––––––––––––––––––––––––––––––––––––––––––––––––––
Balance at
1.4.2005/later Balance at Exercise
Date of grant date of grant Cancelled Exercised 31.3.2006 price Exercisable period
––––––––––––––––––––––––––––––––––––––––––––––––––––––––––––––––––––––––––––––––––––––––––––––––––––––––––––––––––––––––––––––––––––––––––––––––
28.3.2000 17,288,300 (232,800) (899,100) 16,156,400 $2.20 28.3.2001 – 27.3.2010
3.7.2000 7,696,450 (92,900) (3,091,200) 4,512,350 $1.80 3.7.2001 – 2.7.2010
2.7.2001 2,361,950 (13,100) (995,950) 1,352,900 $1.24 2.7.2002 – 1.7.2011
1.7.2002 5,556,050 (22,100) (2,456,100) 3,077,850 $1.60 1.7.2003 – 30.6.2012
1.7.2003 13,661,800 (26,000) (10,578,150) 3,057,650 $1.47 1.7.2004 – 30.6.2013
1.7.2004 16,192,300 (164,200) (33,150) 15,994,950 $2.09 1.7.2005 – 30.6.2014
1.7.2005 15,865,800 (154,600) – 15,711,200 $2.27 1.7.2006 – 30.6.2015
–––––––––––––––––––––––––––––––––––––––––––––––––––––––––––––––––––––––––
78,622,650 (705,700) (18,053,650) 59,863,300
–––––––––––––––––––––––––––––––––––––––––––––––––––––––––––––––––––––––––
(b) SIA Engineering Company Limited (“SIAEC”)
The SIA Engineering Company Limited Employee Share Option Plan (“SIAEC ESOP”), which comprises the Senior Executive
Share Option Scheme and the Employee Share Option Scheme for senior executives and all other employees respectively, was
approved on 9 February 2000.
The basis upon which an option may be exercised is identical to that of the Plan implemented by the Company.
During the fi nancial year, in consideration of the payment of $1.00 for each offer accepted, offers of options were granted
pursuant to the SIAEC ESOP in respect of 16,313,700 unissued shares in SIAEC at an exercise price of $2.45 per share.
At the end of the fi nancial year, options to take up 60,225,575 unissued shares in SIAEC were outstanding:
Number of options to subscribe
for unissued ordinary shares
–––––––––––––––––––––––––––––––––––––––––––––––––––––––––––––––––––––––––
Balance at
1.4.2005/later Balance at Exercise
Date of grant date of grant Cancelled Exercised 31.3.2006 price Exercisable period
––––––––––––––––––––––––––––––––––––––––––––––––––––––––––––––––––––––––––––––––––––––––––––––––––––––––––––––––––––––––––––––––––––––––––––––––
28.3.2000 11,585,500 (45,600) (5,501,500) 6,038,400 $1.85 28.3.2001 – 27.3.2010
3.7.2000 9,417,650 (22,800) (4,386,700) 5,008,150 $1.75 3.7.2001 – 2.7.2010
2.7.2001 4,791,000 – (1,621,350) 3,169,650 $1.21 2.7.2002 – 1.7.2011
1.7.2002 15,429,800 (40,900) (4,338,925) 11,049,975 $2.18 1.7.2003 – 30.6.2012
1.7.2003 7,290,325 (18,250) (3,460,450) 3,811,625 $1.55 1.7.2004 – 30.6.2013
1.7.2004 15,195,500 (166,500) (72,125) 14,956,875 $1.89 1.7.2005 – 30.6.2014
1.7.2005 16,313,700 (122,800) – 16,190,900 $2.45 1.7.2006 – 30.6.2015
–––––––––––––––––––––––––––––––––––––––––––––––––––––––––––––––––––––––––
80,023,475 (416,850) (19,381,050) 60,225,575
–––––––––––––––––––––––––––––––––––––––––––––––––––––––––––––––––––––––––
REPORT BY THE BOARD OF DIRECTORS