Singapore Airlines 2006 Annual Report Download - page 126
Download and view the complete annual report
Please find page 126 of the 2006 Singapore Airlines annual report below. You can navigate through the pages in the report by either clicking on the pages listed below, or by using the keyword search tool below to find specific information within the annual report.-
 1
1 -
2
-
3
-
4
-
5
-
6
-
7
-
8
-
9
-
10
-
11
-
12
-
13
-
14
-
15
-
16
-
17
-
18
-
19
-
20
-
21
-
22
-
23
-
24
-
25
-
26
-
27
-
28
-
29
-
30
-
31
-
32
-
33
-
34
-
35
-
36
-
37
-
38
-
39
-
40
-
41
-
42
-
43
-
44
-
45
-
46
-
47
-
48
-
49
-
50
-
51
-
52
-
53
-
54
-
55
-
56
-
57
-
58
-
59
-
60
-
61
-
62
-
63
-
64
-
65
-
66
-
67
-
68
-
69
-
70
-
71
-
72
-
73
-
74
-
75
-
76
-
77
-
78
-
79
-
80
-
81
-
82
-
83
-
84
-
85
-
86
-
87
-
88
-
89
-
90
-
91
-
92
-
93
-
94
-
95
-
96
-
97
-
98
-
99
-
100
-
101
-
102
-
103
-
104
-
105
-
106
-
107
-
108
-
109
-
110
-
111
-
112
-
113
-
114
-
115
-
 116
116 -
 117
117 -
 118
118 -
 119
119 -
 120
120 -
 121
121 -
 122
122 -
 123
123 -
 124
124 -
 125
125 -
 126
126 -
 127
127 -
 128
128 -
 129
129 -
 130
130 -
 131
131 -
 132
132 -
 133
133 -
 134
134 -
 135
135 -
 136
136 -
137
-
138
-
139
-
140
-
141
-
142
-
143
-
144
-
145
-
146
-
147
-
148
-
149
-
150
-
151
-
152
-
153
-
154
-
155
-
156
 |
 |

124
Singapore Airlines Annual Report 05/06
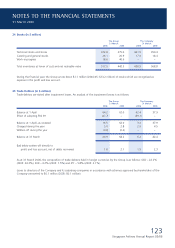
26 Investments (in $ million)
The Group The Company
31 March 31 March
2006 2005 2006 2005
Available-for-sale investments
Quoted investments
Government securities 13.1 6.8 – –
Equity investments 28.2 21.3 – –
Non-equity investments 356.3 13.5 346.1 –
397.6 41.6 346.1 –
Unquoted investments
Non-equity investments 48.9 37.7 – –
48.9 37.7 – –
446.5 79.3 346.1 –
Available-for-sale investments are stated at their fair values with effect from 1 April 2005, in accordance with FRS 39. Prior to
1 April 2005, these investments were stated at cost.
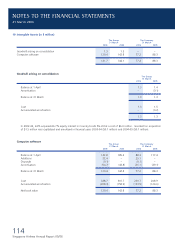
27 Cash and Bank Balances (in $ million)
The Group The Company
31 March 31 March
2006 2005 2006 2005
Fixed deposits 2,451.9 2,231.9 2,256.0 2,049.1
Cash and bank 699.7 608.3 509.1 460.0
3,151.6 2,840.2 2,765.1 2,509.1
As at 31 March 2006, the composition of cash and bank balances held in foreign currencies by the Group is as follows:
USD – 21.8% (2005: 21.7%), EUR – 13.6% (2005: 21.1%) and JPY – 13.2% (2005: 13.3%).
Cash at bank earns interest at floating rates based on daily bank deposit rates ranging from 1.38% to 4.71%
(2004-05: 0.28% to 2.20%) per annum. Short-term deposits are made for varying periods of between one day and three
months depending on the immediate cash requirements of the Group, and earn interests at the respective short-term deposit
rates. The weighted average effective interest rate of short-term deposits is 3.6% (2004-05: 2.5%) per annum.
NOTES TO THE FINANCIAL STATEMENTS
31 March 2006