Singapore Airlines 2006 Annual Report Download - page 49
Download and view the complete annual report
Please find page 49 of the 2006 Singapore Airlines annual report below. You can navigate through the pages in the report by either clicking on the pages listed below, or by using the keyword search tool below to find specific information within the annual report.-
 1
1 -
2
-
3
-
4
-
5
-
6
-
7
-
8
-
9
-
10
-
11
-
12
-
13
-
14
-
15
-
16
-
17
-
18
-
19
-
20
-
21
-
22
-
23
-
24
-
25
-
26
-
27
-
28
-
29
-
30
-
31
-
32
-
33
-
34
-
35
-
36
-
37
-
38
-
 39
39 -
 40
40 -
 41
41 -
 42
42 -
 43
43 -
 44
44 -
 45
45 -
 46
46 -
 47
47 -
 48
48 -
 49
49 -
 50
50 -
 51
51 -
 52
52 -
 53
53 -
 54
54 -
 55
55 -
 56
56 -
 57
57 -
 58
58 -
 59
59 -
60
-
61
-
62
-
63
-
64
-
65
-
66
-
67
-
68
-
69
-
70
-
71
-
72
-
73
-
74
-
75
-
76
-
77
-
78
-
79
-
80
-
81
-
82
-
83
-
84
-
85
-
86
-
87
-
88
-
89
-
90
-
91
-
92
-
93
-
94
-
95
-
96
-
97
-
98
-
99
-
100
-
101
-
102
-
103
-
104
-
105
-
106
-
107
-
108
-
109
-
110
-
111
-
112
-
113
-
114
-
115
-
116
-
117
-
118
-
119
-
120
-
121
-
122
-
123
-
124
-
125
-
126
-
127
-
128
-
129
-
130
-
131
-
132
-
133
-
134
-
135
-
136
-
137
-
138
-
139
-
140
-
141
-
142
-
143
-
144
-
145
-
146
-
147
-
148
-
149
-
150
-
151
-
152
-
153
-
154
-
155
-
156
 |
 |

47
Singapore Airlines Annual Report 05/06
500
400
300
200
100
0
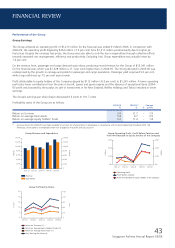
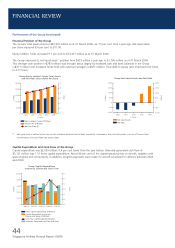
Group Average Staff Strength
and Productivity
$ ‘000
Staff Number
Average Staff Strength
Revenue Per Employee ($’000)
Value Added Per Employee ($’000)
50,000
40,000
30,000
20,000
10,000
0
2001-02 2002-03 2003-04 2004-05 2005-06
FINANCIAL REVIEW
Performance of the Group (continued)
Group Average Staff Strength and Productivity
The Group’s average staff strength increased by four to 28,558 employees. A breakdown is as follows:
2005-06 2004-05 % Change
SIA 13,729 13,572 + 1.2
SATS Group 7,740 8,582 – 9.8
SIAEC Group 5,133 4,663 + 10.1
SIA Cargo 987 819 + 20.5
SilkAir 682 612 + 11.4
Others 287 306 – 6.2
28,558 28,554 –
Average staff productivity is as follows:
2005-06 2004-05 % Change
Revenue per employee ($) 467,158 420,708 + 11.0
Value added per employee ($) 193,781 193,794 –