BP 2006 Annual Report Download - page 98
Download and view the complete annual report
Please find page 98 of the 2006 BP annual report below. You can navigate through the pages in the report by either clicking on the pages listed below, or by using the keyword search tool below to find specific information within the annual report.-
 1
1 -
2
-
3
-
4
-
5
-
6
-
7
-
8
-
9
-
10
-
11
-
12
-
13
-
14
-
15
-
16
-
17
-
18
-
19
-
20
-
21
-
22
-
23
-
24
-
25
-
26
-
27
-
28
-
29
-
30
-
31
-
32
-
33
-
34
-
35
-
36
-
37
-
38
-
39
-
40
-
41
-
42
-
43
-
44
-
45
-
46
-
47
-
48
-
49
-
50
-
51
-
52
-
53
-
54
-
55
-
56
-
57
-
58
-
59
-
60
-
61
-
62
-
63
-
64
-
65
-
66
-
67
-
68
-
69
-
70
-
71
-
72
-
73
-
74
-
75
-
76
-
77
-
78
-
79
-
80
-
81
-
82
-
83
-
84
-
85
-
86
-
87
-
 88
88 -
 89
89 -
 90
90 -
 91
91 -
 92
92 -
 93
93 -
 94
94 -
 95
95 -
 96
96 -
 97
97 -
 98
98 -
 99
99 -
 100
100 -
 101
101 -
 102
102 -
 103
103 -
 104
104 -
 105
105 -
 106
106 -
 107
107 -
 108
108 -
109
-
110
-
111
-
112
-
113
-
114
-
115
-
116
-
117
-
118
-
119
-
120
-
121
-
122
-
123
-
124
-
125
-
126
-
127
-
128
-
129
-
130
-
131
-
132
-
133
-
134
-
135
-
136
-
137
-
138
-
139
-
140
-
141
-
142
-
143
-
144
-
145
-
146
-
147
-
148
-
149
-
150
-
151
-
152
-
153
-
154
-
155
-
156
-
157
-
158
-
159
-
160
-
161
-
162
-
163
-
164
-
165
-
166
-
167
-
168
-
169
-
170
-
171
-
172
-
173
-
174
-
175
-
176
-
177
-
178
-
179
-
180
-
181
-
182
-
183
-
184
-
185
-
186
-
187
-
188
-
189
-
190
-
191
-
192
-
193
-
194
-
195
-
196
-
197
-
198
-
199
-
200
-
201
-
202
-
203
-
204
-
205
-
206
-
207
-
208
-
209
-
210
-
211
-
212
-
213
-
214
-
215
-
216
-
217
-
218
-
219
-
220
-
221
-
222
-
223
-
224
-
225
-
226
-
227
-
228
 |
 |

96
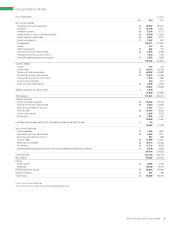
Group income statement
For the year ended 31 December $ million
------------------------------------------------------------------------------------------------------------------------------------------------------------------------------------------------------------------------------------------------------------------------------------------------------------
Note 2006 2005 2004
------------------------------------------------------------------------------------------------------------------------------------------------------------------------------------------------------------------------------------------------------------------------------------------------------------
Sales and other operating revenues 7265,906 239,792 192,024
Earnings from jointly controlled entities – after interest and tax 83,553 3,083 1,818
Earnings from associates – after interest and tax 8442 460 462
Interest and other revenues 9701 613 615
------------------------------------------------------------------------------------------------------------------------------------------------------------------------------------------------------------------------------------------------------------------------------------------------------------
Total revenues 270,602 243,948 194,919
Gains on sale of businesses and fixed assets 10 3,714 1,538 1,685
------------------------------------------------------------------------------------------------------------------------------------------------------------------------------------------------------------------------------------------------------------------------------------------------------------
Total revenues and other income 274,316 245,486 196,604
Purchases 187,183 163,026 128,055
Production and manufacturing expenses 23,793 21,092 17,330
Production and similar taxes 11 3,621 3,010 2,149
Depreciation, depletion and amortization 12 9,128 8,771 8,529
Impairment and losses on sale of businesses and fixed assets 13 549 468 1,390
Exploration expense 19 1,045 684 637
Distribution and administration expenses 15 14,447 13,706 12,768
Fair value (gain) loss on embedded derivatives 36 (608) 2,047 –
------------------------------------------------------------------------------------------------------------------------------------------------------------------------------------------------------------------------------------------------------------------------------------------------------------
Profit before interest and taxation from continuing operations 35,158 32,682 25,746
Finance costs 21 718 616 440
Other finance (income) expense 22 (202) 145 340
------------------------------------------------------------------------------------------------------------------------------------------------------------------------------------------------------------------------------------------------------------------------------------------------------------
Profit before taxation from continuing operations 34,642 31,921 24,966
Taxation 23 12,331 9,473 7,082
------------------------------------------------------------------------------------------------------------------------------------------------------------------------------------------------------------------------------------------------------------------------------------------------------------
Profit from continuing operations 22,311 22,448 17,884
Profit (loss) from Innovene operations 5(25) 184 (622)
------------------------------------------------------------------------------------------------------------------------------------------------------------------------------------------------------------------------------------------------------------------------------------------------------------
Profit for the year 22,286 22,632 17,262
Attributable to
BP shareholders 22,000 22,341 17,075
Minority interest 286 291 187
------------------------------------------------------------------------------------------------------------------------------------------------------------------------------------------------------------------------------------------------------------------------------------------------------------
22,286 22,632 17,262
Earnings per share – cents
Profit for the year attributable to BP shareholders
Basic 25 109.84 105.74 78.24
Diluted 25 109.00 104.52 76.87
------------------------------------------------------------------------------------------------------------------------------------------------------------------------------------------------------------------------------------------------------------------------------------------------------------
Profit from continuing operations attributable to BP shareholders
Basic 109.97 104.87 81.09
Diluted 109.12 103.66 79.66