BP 2006 Annual Report Download - page 62
Download and view the complete annual report
Please find page 62 of the 2006 BP annual report below. You can navigate through the pages in the report by either clicking on the pages listed below, or by using the keyword search tool below to find specific information within the annual report.-
 1
1 -
2
-
3
-
4
-
5
-
6
-
7
-
8
-
9
-
10
-
11
-
12
-
13
-
14
-
15
-
16
-
17
-
18
-
19
-
20
-
21
-
22
-
23
-
24
-
25
-
26
-
27
-
28
-
29
-
30
-
31
-
32
-
33
-
34
-
35
-
36
-
37
-
38
-
39
-
40
-
41
-
42
-
43
-
44
-
45
-
46
-
47
-
48
-
49
-
50
-
51
-
 52
52 -
 53
53 -
 54
54 -
 55
55 -
 56
56 -
 57
57 -
 58
58 -
 59
59 -
 60
60 -
 61
61 -
 62
62 -
 63
63 -
 64
64 -
 65
65 -
 66
66 -
 67
67 -
 68
68 -
 69
69 -
 70
70 -
 71
71 -
 72
72 -
73
-
74
-
75
-
76
-
77
-
78
-
79
-
80
-
81
-
82
-
83
-
84
-
85
-
86
-
87
-
88
-
89
-
90
-
91
-
92
-
93
-
94
-
95
-
96
-
97
-
98
-
99
-
100
-
101
-
102
-
103
-
104
-
105
-
106
-
107
-
108
-
109
-
110
-
111
-
112
-
113
-
114
-
115
-
116
-
117
-
118
-
119
-
120
-
121
-
122
-
123
-
124
-
125
-
126
-
127
-
128
-
129
-
130
-
131
-
132
-
133
-
134
-
135
-
136
-
137
-
138
-
139
-
140
-
141
-
142
-
143
-
144
-
145
-
146
-
147
-
148
-
149
-
150
-
151
-
152
-
153
-
154
-
155
-
156
-
157
-
158
-
159
-
160
-
161
-
162
-
163
-
164
-
165
-
166
-
167
-
168
-
169
-
170
-
171
-
172
-
173
-
174
-
175
-
176
-
177
-
178
-
179
-
180
-
181
-
182
-
183
-
184
-
185
-
186
-
187
-
188
-
189
-
190
-
191
-
192
-
193
-
194
-
195
-
196
-
197
-
198
-
199
-
200
-
201
-
202
-
203
-
204
-
205
-
206
-
207
-
208
-
209
-
210
-
211
-
212
-
213
-
214
-
215
-
216
-
217
-
218
-
219
-
220
-
221
-
222
-
223
-
224
-
225
-
226
-
227
-
228
 |
 |

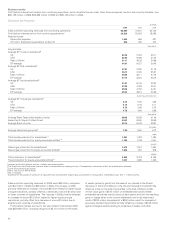
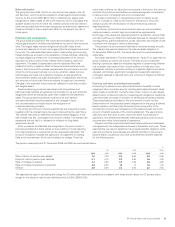
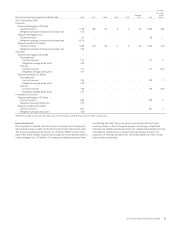
The assumed rate of investment return and discount rate have a significant effect on the amounts reported. A one-percentage-point change in these
assumptions for the group’s plans would have had the following effects.
$million
------------------------------------------------------------------------------------------------------------------------------------------------------------------------------------------------------------------------------------------------------------------------------------------------------------
One-percentage-point
------------------------------------------------------------------------------------------------------------------------------------------------------------------------------------------------------------------------------------------------------------------------------------------------------------
Increase Decrease
------------------------------------------------------------------------------------------------------------------------------------------------------------------------------------------------------------------------------------------------------------------------------------------------------------
Investment return
Effect on pension and other post-retirement benefit expense in 2007 (383) 383
Discount rate
Effect on pension and other post-retirement benefit expense in 2007 (52) 75
Effect on pension and other post-retirement benefit obligation at 31 December 2006 (5,013) 6,433
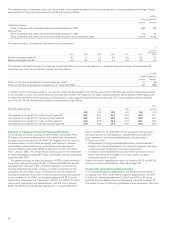
The assumed future US healthcare cost trend rate is shown below.
%
------------------------------------------------------------------------------------------------------------------------------------------------------------------------------------------------------------------------------------------------------------------------------------------------------------
2007 2008 2009 2010 2011 2012
2013 and
subsequent
years
------------------------------------------------------------------------------------------------------------------------------------------------------------------------------------------------------------------------------------------------------------------------------------------------------------
Beneficiaries aged under 65 8.0 7.5 7.0 6.5 6.0 5.5 5.0
Beneficiaries aged over 65 10.0 9.5 8.5 7.5 6.5 5.5 5.0
The assumed US healthcare cost trend rate has a significant effect on the amounts reported. A one-percentage-point change in the assumed US
healthcare cost trend rate would have had the following effects.
$million
------------------------------------------------------------------------------------------------------------------------------------------------------------------------------------------------------------------------------------------------------------------------------------------------------------
One-percentage-point
------------------------------------------------------------------------------------------------------------------------------------------------------------------------------------------------------------------------------------------------------------------------------------------------------------
Increase Decrease
------------------------------------------------------------------------------------------------------------------------------------------------------------------------------------------------------------------------------------------------------------------------------------------------------------
Effect on US other post-retirement benefit expense in 2007 31 (25)
Effect on US other post-retirement obligation at 31 December 2006 349 (289)
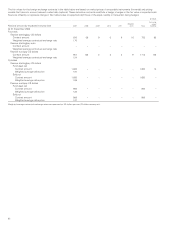
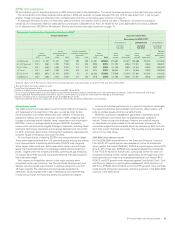
In addition to the financial assumptions, we regularly review the demographic and mortality assumptions. Mortality assumptions reflect best practice
in the countries in which we provide pensions and have been chosen with regard to the latest available published tables adjusted where appropriate
to reflect the experience of the group and an extrapolation of past longevity improvements into the future. BP’s most substantial pension liabilities
are in the UK, the US and Germany, where our assumptions are as follows.
Years
------------------------------------------------------------------------------------------------------------------------------------------------------------------------------------------------------------------------------------------------------------------------------------------------------------
Mortality assumptions UK USA Germany
------------------------------------------------------------------------------------------------------------------------------------------------------------------------------------------------------------------------------------------------------------------------------------------------------------
2006 2005 2006 2005 2006 2005
------------------------------------------------------------------------------------------------------------------------------------------------------------------------------------------------------------------------------------------------------------------------------------------------------------
Life expectancy at age 60 for a male currently aged 60 23.9 23.0 24.2 21.9 22.2 22.1
Life expectancy at age 60 for a female currently aged 60 26.8 26.0 26.0 25.6 26.9 26.7
Life expectancy at age 60 for a male currently aged 40 25.0 23.9 25.8 21.9 25.2 25.0
Life expectancy at age 60 for a female currently aged 40 27.8 26.9 26.9 25.6 29.6 29.4
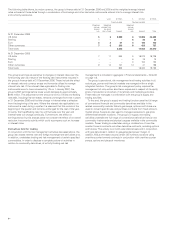
Adoption of International Financial Reporting Standards
For all periods up to and including the year ended 31 December 2004,
BP prepared its financial statements in accordance with UK generally
accepted accounting practice (UK GAAP). BP, together with all other EU
companies listed on an EU stock exchange, was required to prepare
consolidated financial statements in accordance with International
Financial Reporting Standards (IFRS) as adopted by the EU with effect
from 1 January 2005. The Annual Report and Accounts for the year ended
31 December 2005 comprised BP’s first consolidated financial statements
prepared under IFRS.
The general principle for first-time adoption of IFRS is that standards in
force at the first reporting date (for BP, 31 December 2005) are applied
retrospectively. However, IFRS 1 ‘First-time Adoption of International
Financial Reporting Standards’ contains a number of exemptions that
companies are permitted to apply. BP elected to take the exemption
allowing comparative information on financial instruments to be prepared
in accordance with UK GAAP and the group adopted IAS 32 ‘Financial
Instruments: Disclosure and Presentation’ (IAS 32) and IAS 39 ‘Financial
Instruments: Recognition and Measurement’ (IAS 39) from 1 January
2005. Had IAS 32 and IAS 39 been applied from 1 January 2003, BP’s
date of transition for all other IFRS in force at the first reporting date,
the following are the most significant adjustments that would have
been necessary in the financial statements for the year ended
31 December 2004:
– All derivatives, including embedded derivatives, would have been
brought on to the balance sheet at fair value and changes in fair value
would have been recognized in the income statement.
– Available-for-sale investments would have been carried at fair value
rather than at cost and changes in fair value would have been
recognized directly in equity.
Further information regarding the impact of adopting IAS 32 and IAS 39
is shown in Financial statements – Note 49 on page 168.
US generally accepted accounting principles
The consolidated financial statements of the BP group are prepared in
accordance with IFRS, which differs in certain respects from US GAAP.
The principal differences between US GAAP and IFRS for BP group
reporting are discussed in Financial statements – Note 53 on page 179.
The impact of new US accounting standards is also disclosed in that note.
60