BP 2006 Annual Report Download - page 220
Download and view the complete annual report
Please find page 220 of the 2006 BP annual report below. You can navigate through the pages in the report by either clicking on the pages listed below, or by using the keyword search tool below to find specific information within the annual report.-
 1
1 -
2
-
3
-
4
-
5
-
6
-
7
-
8
-
9
-
10
-
11
-
12
-
13
-
14
-
15
-
16
-
17
-
18
-
19
-
20
-
21
-
22
-
23
-
24
-
25
-
26
-
27
-
28
-
29
-
30
-
31
-
32
-
33
-
34
-
35
-
36
-
37
-
38
-
39
-
40
-
41
-
42
-
43
-
44
-
45
-
46
-
47
-
48
-
49
-
50
-
51
-
52
-
53
-
54
-
55
-
56
-
57
-
58
-
59
-
60
-
61
-
62
-
63
-
64
-
65
-
66
-
67
-
68
-
69
-
70
-
71
-
72
-
73
-
74
-
75
-
76
-
77
-
78
-
79
-
80
-
81
-
82
-
83
-
84
-
85
-
86
-
87
-
88
-
89
-
90
-
91
-
92
-
93
-
94
-
95
-
96
-
97
-
98
-
99
-
100
-
101
-
102
-
103
-
104
-
105
-
106
-
107
-
108
-
109
-
110
-
111
-
112
-
113
-
114
-
115
-
116
-
117
-
118
-
119
-
120
-
121
-
122
-
123
-
124
-
125
-
126
-
127
-
128
-
129
-
130
-
131
-
132
-
133
-
134
-
135
-
136
-
137
-
138
-
139
-
140
-
141
-
142
-
143
-
144
-
145
-
146
-
147
-
148
-
149
-
150
-
151
-
152
-
153
-
154
-
155
-
156
-
157
-
158
-
159
-
160
-
161
-
162
-
163
-
164
-
165
-
166
-
167
-
168
-
169
-
170
-
171
-
172
-
173
-
174
-
175
-
176
-
177
-
178
-
179
-
180
-
181
-
182
-
183
-
184
-
185
-
186
-
187
-
188
-
189
-
190
-
191
-
192
-
193
-
194
-
195
-
196
-
197
-
198
-
199
-
200
-
201
-
202
-
203
-
204
-
205
-
206
-
207
-
208
-
209
-
 210
210 -
 211
211 -
 212
212 -
 213
213 -
 214
214 -
 215
215 -
 216
216 -
 217
217 -
 218
218 -
 219
219 -
 220
220 -
 221
221 -
 222
222 -
 223
223 -
 224
224 -
 225
225 -
 226
226 -
 227
227 -
 228
228
 |
 |

218
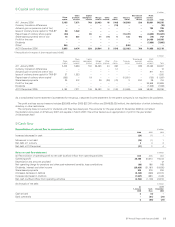
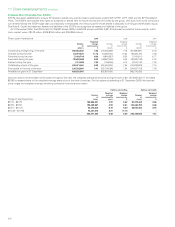
11 Share-based payments continued
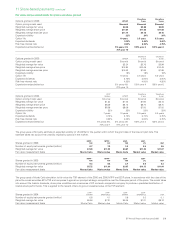
Employee Share Ownership Plans (ESOPs)
ESOPs have been established to acquire BP shares to satisfy any awards made to participants under EDIP, MTPP, LTPP, DAB and the BP ShareMatch
Plans. The ESOPs have waived their rights to dividends on shares held for future awards and are funded by the group. Until such time as the company’s
own shares held by the ESOP trusts vest unconditionally in employees, the amount paid for those shares is deducted in arriving at shareholders’ equity.
See Note 8, Capital and reserves. Assets and liabilities of the ESOPs are recognized as assets and liabilities of the group.
At 31 December 2006, the ESOPs held 12,795,887 shares (2005 14,560,003 shares and 2004 8,621,219 shares) for potential future awards, which
had a market value of $142 million (2005 $156 million and 2004 $84 million).
------------------------------------------------------------------------------------------------------------------------------------------------------------------------------------------------------------------------------------------------------------------------------------------------------------
Share option transactions 2006 2005 2004
------------------------------------------------------------------------------------------------------------------------------------------------------------------------------------------------------------------------------------------------------------------------------------------------------------
Number
of
options
Weighted
average
exercise price
$
Number
of
options
Weighted
average
exercise price
$
Number
of
options
Weighted
average
exercise price
$
------------------------------------------------------------------------------------------------------------------------------------------------------------------------------------------------------------------------------------------------------------------------------------------------------------
Outstanding at beginning of the year 450,453,502 7.64 470,263,808 7.16 461,885,881 6.76
Granted during the year 53,977,639 11.18 54,482,053 10.24 80,394,760 7.93
Forfeited during the year (7,169,710) 8.69 (4,844,827) 8.30 (7,043,911) 6.77
Exercised during the year (70,658,480) 6.52 (68,687,976) 6.40 (62,625,182) 5.18
Expired during the year (131,489) 7.99 (759,556) 6.75 (2,347,740) 7.55
------------------------------------------------------------------------------------------------------------------------------------------------------------------------------------------------------------------------------------------------------------------------------------------------------------
Outstanding at end of the year 426,471,462 8.25 450,453,502 7.64 470,263,808 7.16
------------------------------------------------------------------------------------------------------------------------------------------------------------------------------------------------------------------------------------------------------------------------------------------------------------
Exercisable at the end of the year 236,726,966 7.41 222,729,398 7.54 224,627,758 7.00
Available for grant at 31 December 699,535,945 955,924,506 966,076,636
As share options are exercised continuously throughout the year, the weighted average share price during the year of $11.85 (2005 $10.77 and 2004
$8.95) is representative of the weighted average share price at the date of exercise. For the options outstanding at 31 December 2006, the exercise
price ranges and weighted average remaining contractual lives are shown below.
------------------------------------------------------------------------------------------------------------------------------------------------------------------------------------------------------------------------------------------------------------------------------------------------------------
Options outstanding Options exercisable
------------------------------------------------------------------------------------------------------------------------------------------------------------------------------------------------------------------------------------------------------------------------------------------------------------
Range of exercise prices
Number
of
shares
Weighted
average
remaining life
years
Weighted
average
exercise price
$
Number
of
shares
Weighted
average
exercise price
$
------------------------------------------------------------------------------------------------------------------------------------------------------------------------------------------------------------------------------------------------------------------------------------------------------------
$5.10 – $6.79 100,854,491 3.92 6.02 87,474,704 6.06
$6.80 – $8.50 196,009,067 4.93 8.01 122,344,799 8.08
$8.51 – $10.21 55,376,829 5.79 9.30 26,907,463 8.76
$10.22 – $11.92 74,231,075 8.81 11.14 – –
------------------------------------------------------------------------------------------------------------------------------------------------------------------------------------------------------------------------------------------------------------------------------------------------------------
426,471,462 5.48 8.25 236,726,966 7.41