BP 2006 Annual Report Download - page 203
Download and view the complete annual report
Please find page 203 of the 2006 BP annual report below. You can navigate through the pages in the report by either clicking on the pages listed below, or by using the keyword search tool below to find specific information within the annual report.-
 1
1 -
2
-
3
-
4
-
5
-
6
-
7
-
8
-
9
-
10
-
11
-
12
-
13
-
14
-
15
-
16
-
17
-
18
-
19
-
20
-
21
-
22
-
23
-
24
-
25
-
26
-
27
-
28
-
29
-
30
-
31
-
32
-
33
-
34
-
35
-
36
-
37
-
38
-
39
-
40
-
41
-
42
-
43
-
44
-
45
-
46
-
47
-
48
-
49
-
50
-
51
-
52
-
53
-
54
-
55
-
56
-
57
-
58
-
59
-
60
-
61
-
62
-
63
-
64
-
65
-
66
-
67
-
68
-
69
-
70
-
71
-
72
-
73
-
74
-
75
-
76
-
77
-
78
-
79
-
80
-
81
-
82
-
83
-
84
-
85
-
86
-
87
-
88
-
89
-
90
-
91
-
92
-
93
-
94
-
95
-
96
-
97
-
98
-
99
-
100
-
101
-
102
-
103
-
104
-
105
-
106
-
107
-
108
-
109
-
110
-
111
-
112
-
113
-
114
-
115
-
116
-
117
-
118
-
119
-
120
-
121
-
122
-
123
-
124
-
125
-
126
-
127
-
128
-
129
-
130
-
131
-
132
-
133
-
134
-
135
-
136
-
137
-
138
-
139
-
140
-
141
-
142
-
143
-
144
-
145
-
146
-
147
-
148
-
149
-
150
-
151
-
152
-
153
-
154
-
155
-
156
-
157
-
158
-
159
-
160
-
161
-
162
-
163
-
164
-
165
-
166
-
167
-
168
-
169
-
170
-
171
-
172
-
173
-
174
-
175
-
176
-
177
-
178
-
179
-
180
-
181
-
182
-
183
-
184
-
185
-
186
-
187
-
188
-
189
-
190
-
191
-
192
-
 193
193 -
 194
194 -
 195
195 -
 196
196 -
 197
197 -
 198
198 -
 199
199 -
 200
200 -
 201
201 -
 202
202 -
 203
203 -
 204
204 -
 205
205 -
 206
206 -
 207
207 -
 208
208 -
 209
209 -
 210
210 -
 211
211 -
 212
212 -
 213
213 -
214
-
215
-
216
-
217
-
218
-
219
-
220
-
221
-
222
-
223
-
224
-
225
-
226
-
227
-
228
 |
 |

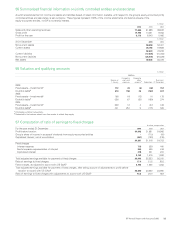
BP Annual Report and Accounts 2006 201
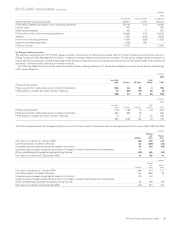
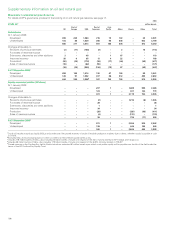
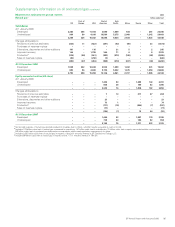
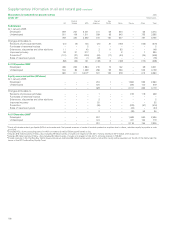
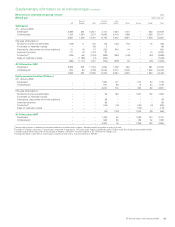
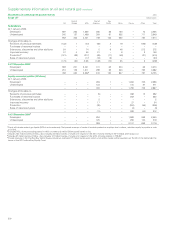
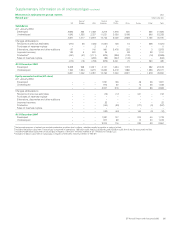
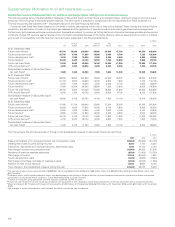
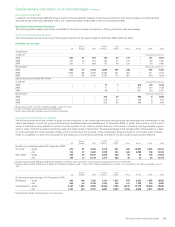
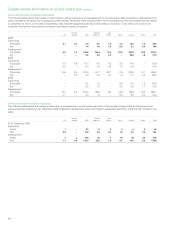
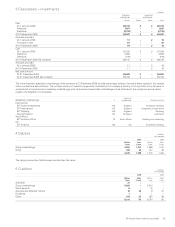
Supplementary information on oil and natural gas continued
Movements in estimated net proved reserves 2004
------------------------------------------------------------------------------------------------------------------------------------------------------------------------------------------------------------------------------------------------------------------------------------------------------------
Natural gasabillion cubic feet
------------------------------------------------------------------------------------------------------------------------------------------------------------------------------------------------------------------------------------------------------------------------------------------------------------
UK
Rest of
Europe USA
Rest of
Americas
Asia
Pacific Africa Russia Other Total
------------------------------------------------------------------------------------------------------------------------------------------------------------------------------------------------------------------------------------------------------------------------------------------------------------
Subsidiaries
At 1 January 2004
Developed 2,996 262 11,482 4,212 1,976 640 – 255 21,823
Undeveloped 1,095 1,255 3,337 11,531 3,026 2,188 – 900 23,332
------------------------------------------------------------------------------------------------------------------------------------------------------------------------------------------------------------------------------------------------------------------------------------------------------------
4,091 1,517 14,819 15,743 5,002 2,828 – 1,155 45,155
Changes attributable to
Revisions of previous estimates (210) 28 (438) (1,081) 106 16 – 558 (1,021)
Purchases of reserves-in-place ––32––––5
Extensions, discoveries and other additions 127 – 140 991 2,478 233 – 3 3,972
Improved recovery 134 4 870 76 – 29 – 38 1,151
Productionb(461) (47) (1,111) (875) (296) (102) – (76) (2,968)
Sales of reserves-in-place – – (202) (92) (247) (103) – – (644)
------------------------------------------------------------------------------------------------------------------------------------------------------------------------------------------------------------------------------------------------------------------------------------------------------------
(410) (15) (738) (979) 2,041 73 – 523 495
At 31 December 2004c
Developed 2,498 248 10,811 4,101 1,624 1,015 – 282 20,579
Undeveloped 1,183 1,254 3,270 10,663 5,419 1,886 – 1,396 25,071
------------------------------------------------------------------------------------------------------------------------------------------------------------------------------------------------------------------------------------------------------------------------------------------------------------
3,681 1,502 14,081 14,764 7,043 2,901 – 1,678 45,650
Equity-accounted entities (BP share)
At 1 January 2004
Developed – – – 1,591 136 – 46 58 1,831
Undeveloped – – – 916 80 – 14 28 1,038
------------------------------------------------------------------------------------------------------------------------------------------------------------------------------------------------------------------------------------------------------------------------------------------------------------
– – – 2,507 216 – 60 86 2,869
Changes attributable to
Revisions of previous estimates – – – (12) (17) – 341 – 312
Purchases of reserves-in-place –––––––––
Extensions, discoveries and other additions –––––––––
Improved recovery –––23––––23
Production – – – (144) (23) – (177) (3) (347)
Sales of reserves-in-place –––––––––
------------------------------------------------------------------------------------------------------------------------------------------------------------------------------------------------------------------------------------------------------------------------------------------------------------
– – – (133) (40) – 164 (3) (12)
At 31 December 2004d
Developed – – – 1,397 107 – 214 60 1,778
Undeveloped – – – 977 69 – 10 23 1,079
------------------------------------------------------------------------------------------------------------------------------------------------------------------------------------------------------------------------------------------------------------------------------------------------------------
– – – 2,374 176 – 224 83 2,857
aNet proved reserves of natural gas exclude production royalties due to others, whether royalty is payable in cash or in kind.
bIncludes 190 billion cubic feet of natural gas consumed in operations, 165 billion cubic feet in subsidiaries and 25 billion cubic feet in equity-accounted entities.
cIncludes 4,064 billion cubic feet of natural gas in respect of the 30% minority interest in BP Trinidad and Tobago LLC.
dIncludes 13 billion cubic feet of natural gas in respect of the 5.9% minority interest in TNK-BP.