BP 2006 Annual Report Download - page 129
Download and view the complete annual report
Please find page 129 of the 2006 BP annual report below. You can navigate through the pages in the report by either clicking on the pages listed below, or by using the keyword search tool below to find specific information within the annual report.-
 1
1 -
2
-
3
-
4
-
5
-
6
-
7
-
8
-
9
-
10
-
11
-
12
-
13
-
14
-
15
-
16
-
17
-
18
-
19
-
20
-
21
-
22
-
23
-
24
-
25
-
26
-
27
-
28
-
29
-
30
-
31
-
32
-
33
-
34
-
35
-
36
-
37
-
38
-
39
-
40
-
41
-
42
-
43
-
44
-
45
-
46
-
47
-
48
-
49
-
50
-
51
-
52
-
53
-
54
-
55
-
56
-
57
-
58
-
59
-
60
-
61
-
62
-
63
-
64
-
65
-
66
-
67
-
68
-
69
-
70
-
71
-
72
-
73
-
74
-
75
-
76
-
77
-
78
-
79
-
80
-
81
-
82
-
83
-
84
-
85
-
86
-
87
-
88
-
89
-
90
-
91
-
92
-
93
-
94
-
95
-
96
-
97
-
98
-
99
-
100
-
101
-
102
-
103
-
104
-
105
-
106
-
107
-
108
-
109
-
110
-
111
-
112
-
113
-
114
-
115
-
116
-
117
-
118
-
 119
119 -
 120
120 -
 121
121 -
 122
122 -
 123
123 -
 124
124 -
 125
125 -
 126
126 -
 127
127 -
 128
128 -
 129
129 -
 130
130 -
 131
131 -
 132
132 -
 133
133 -
 134
134 -
 135
135 -
 136
136 -
 137
137 -
 138
138 -
 139
139 -
140
-
141
-
142
-
143
-
144
-
145
-
146
-
147
-
148
-
149
-
150
-
151
-
152
-
153
-
154
-
155
-
156
-
157
-
158
-
159
-
160
-
161
-
162
-
163
-
164
-
165
-
166
-
167
-
168
-
169
-
170
-
171
-
172
-
173
-
174
-
175
-
176
-
177
-
178
-
179
-
180
-
181
-
182
-
183
-
184
-
185
-
186
-
187
-
188
-
189
-
190
-
191
-
192
-
193
-
194
-
195
-
196
-
197
-
198
-
199
-
200
-
201
-
202
-
203
-
204
-
205
-
206
-
207
-
208
-
209
-
210
-
211
-
212
-
213
-
214
-
215
-
216
-
217
-
218
-
219
-
220
-
221
-
222
-
223
-
224
-
225
-
226
-
227
-
228
 |
 |

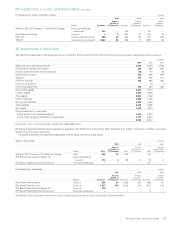
BP Annual Report and Accounts 2006 127
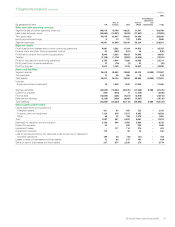
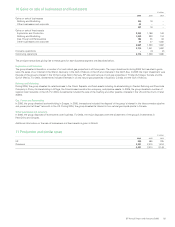
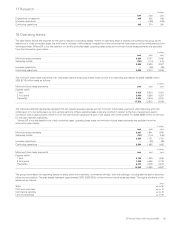
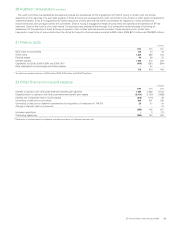
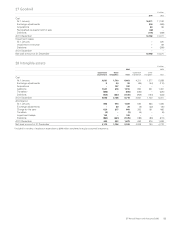
17 Research
$ million
------------------------------------------------------------------------------------------------------------------------------------------------------------------------------------------------------------------------------------------------------------------------------------------------------------
2006 2005 2004
------------------------------------------------------------------------------------------------------------------------------------------------------------------------------------------------------------------------------------------------------------------------------------------------------------
Expenditure on research 395 502 439
Innovene operations –(128) (139)
------------------------------------------------------------------------------------------------------------------------------------------------------------------------------------------------------------------------------------------------------------------------------------------------------------
Continuing operations 395 374 300
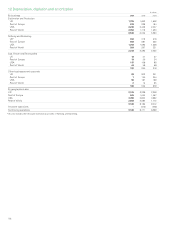
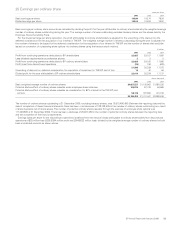
18 Operating leases
The table below shows the expense for the year in respect of operating leases. Where an operating lease is entered into solely by the group as the
operator of a jointly controlled asset, the total cost is included in this analysis, irrespective of any amounts that have been or will be reimbursed by joint
venture partners. Where BP is not the operator of a jointly controlled asset, operating lease costs and minimum future lease payments are excluded
from the information given below.
$ million
------------------------------------------------------------------------------------------------------------------------------------------------------------------------------------------------------------------------------------------------------------------------------------------------------------
2006 2005 2004
------------------------------------------------------------------------------------------------------------------------------------------------------------------------------------------------------------------------------------------------------------------------------------------------------------
Minimum lease payments 3,660 2,737 2,442
Sub-lease rentals (131) (114) (115)
------------------------------------------------------------------------------------------------------------------------------------------------------------------------------------------------------------------------------------------------------------------------------------------------------------
3,529 2,623 2,327
Innovene operations —(49) (89)
------------------------------------------------------------------------------------------------------------------------------------------------------------------------------------------------------------------------------------------------------------------------------------------------------------
Continuing operations 3,529 2,574 2,238
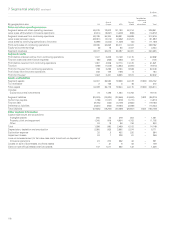
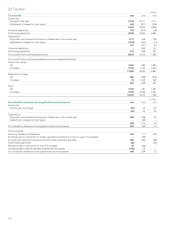
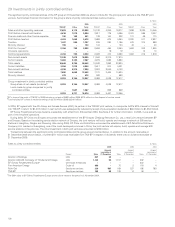
The minimum future lease payments at 31 December (before deducting related rental income from operating sub-leases, for 2006 of $626 million,
2005 $718 million) were as follows:
$ million
------------------------------------------------------------------------------------------------------------------------------------------------------------------------------------------------------------------------------------------------------------------------------------------------------------
Minimum future lease payments 2006 2005 2004
------------------------------------------------------------------------------------------------------------------------------------------------------------------------------------------------------------------------------------------------------------------------------------------------------------
Payable within
1year 3,428 2,610 2,061
2 to 5 years 8,440 6,584 4,357
Thereafter 5,684 4,619 3,341
------------------------------------------------------------------------------------------------------------------------------------------------------------------------------------------------------------------------------------------------------------------------------------------------------------
17,552 13,813 9,759
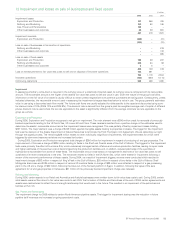
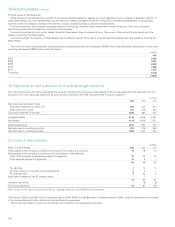
The following additional disclosures represent the net operating lease expense and net minimum future lease payments, after deducting amounts
reimbursed, or to be reimbursed, by joint venture partners. Where operating lease costs are incurred in relation to the hire of equipment used in
connection with a capital project, some or all of the cost may be capitalized as part of the capital cost of the project. For 2006, $895 million of the cost
for the year has been capitalized.
Where BP is not the operator of a jointly controlled asset, operating lease costs and minimum future lease payments are excluded from the
information given below.
$ million
------------------------------------------------------------------------------------------------------------------------------------------------------------------------------------------------------------------------------------------------------------------------------------------------------------
2006 2005 2004
------------------------------------------------------------------------------------------------------------------------------------------------------------------------------------------------------------------------------------------------------------------------------------------------------------
Minimum lease payments 2,937 1,841 1,840
Sub-lease rentals (131) (110) (109)
------------------------------------------------------------------------------------------------------------------------------------------------------------------------------------------------------------------------------------------------------------------------------------------------------------
2,806 1,731 1,731
Innovene operations —(49) (89)
------------------------------------------------------------------------------------------------------------------------------------------------------------------------------------------------------------------------------------------------------------------------------------------------------------
Continuing operations 2,806 1,682 1,642
$ million
------------------------------------------------------------------------------------------------------------------------------------------------------------------------------------------------------------------------------------------------------------------------------------------------------------
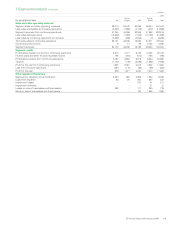
Minimum future lease payments 2006 2005 2004
------------------------------------------------------------------------------------------------------------------------------------------------------------------------------------------------------------------------------------------------------------------------------------------------------------
Payable within
1year 2,732 1,643 1,534
2 to 5 years 7,290 4,666 3,778
Thereafter 5,221 4,579 3,275
------------------------------------------------------------------------------------------------------------------------------------------------------------------------------------------------------------------------------------------------------------------------------------------------------------
15,243 10,888 8,587
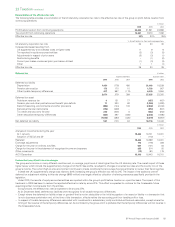
The group has entered into operating leases on ships, plant and machinery, commercial vehicles, land and buildings, including service station sites and
office accommodation. The ship leases represent approximately 36% (2005 52%) of the minimum future lease payments. The typical durations of the
leases are as follows:
Years
------------------------------------------------------------------------------------------------------------------------------------------------------------------------------------------------------------------------------------------------------------------------------------------------------------
Ships up to 20
Plant and machinery up to 10
Commercial vehicles up to 15
Land and buildings up to 40