BP 2006 Annual Report Download - page 51
Download and view the complete annual report
Please find page 51 of the 2006 BP annual report below. You can navigate through the pages in the report by either clicking on the pages listed below, or by using the keyword search tool below to find specific information within the annual report.-
 1
1 -
2
-
3
-
4
-
5
-
6
-
7
-
8
-
9
-
10
-
11
-
12
-
13
-
14
-
15
-
16
-
17
-
18
-
19
-
20
-
21
-
22
-
23
-
24
-
25
-
26
-
27
-
28
-
29
-
30
-
31
-
32
-
33
-
34
-
35
-
36
-
37
-
38
-
39
-
40
-
 41
41 -
 42
42 -
 43
43 -
 44
44 -
 45
45 -
 46
46 -
 47
47 -
 48
48 -
 49
49 -
 50
50 -
 51
51 -
 52
52 -
 53
53 -
 54
54 -
 55
55 -
 56
56 -
 57
57 -
 58
58 -
 59
59 -
 60
60 -
 61
61 -
62
-
63
-
64
-
65
-
66
-
67
-
68
-
69
-
70
-
71
-
72
-
73
-
74
-
75
-
76
-
77
-
78
-
79
-
80
-
81
-
82
-
83
-
84
-
85
-
86
-
87
-
88
-
89
-
90
-
91
-
92
-
93
-
94
-
95
-
96
-
97
-
98
-
99
-
100
-
101
-
102
-
103
-
104
-
105
-
106
-
107
-
108
-
109
-
110
-
111
-
112
-
113
-
114
-
115
-
116
-
117
-
118
-
119
-
120
-
121
-
122
-
123
-
124
-
125
-
126
-
127
-
128
-
129
-
130
-
131
-
132
-
133
-
134
-
135
-
136
-
137
-
138
-
139
-
140
-
141
-
142
-
143
-
144
-
145
-
146
-
147
-
148
-
149
-
150
-
151
-
152
-
153
-
154
-
155
-
156
-
157
-
158
-
159
-
160
-
161
-
162
-
163
-
164
-
165
-
166
-
167
-
168
-
169
-
170
-
171
-
172
-
173
-
174
-
175
-
176
-
177
-
178
-
179
-
180
-
181
-
182
-
183
-
184
-
185
-
186
-
187
-
188
-
189
-
190
-
191
-
192
-
193
-
194
-
195
-
196
-
197
-
198
-
199
-
200
-
201
-
202
-
203
-
204
-
205
-
206
-
207
-
208
-
209
-
210
-
211
-
212
-
213
-
214
-
215
-
216
-
217
-
218
-
219
-
220
-
221
-
222
-
223
-
224
-
225
-
226
-
227
-
228
 |
 |

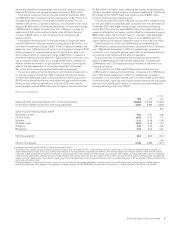
were higher liquids and gas realizations, higher refining margins and
higher contributions from the operating business within the Gas, Power
and Renewables segment, partially offset by lower retail marketing
margins, higher costs (including the Thunder Horse incident, the Texas
City refinery shutdown and planned restructuring actions) and significant
volatility arising under IFRS fair value accounting.
Profits and margins for the group and for individual business segments
can vary significantly from period to period as a result of changes in such
factors as oil prices, natural gas prices and refining margins. Accordingly,
the results for the current and prior periods do not necessarily reflect
trends, nor do they provide indicators of results for future periods.
Employee numbers were approximately 97,000 at 31 December 2006,
96,200 at 31 December 2005 and 102,900 at 31 December 2004. The
decrease in 2005 resulted primarily from the sale of Innovene.
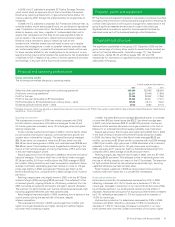
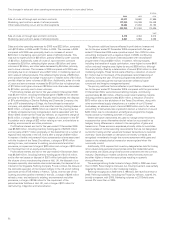
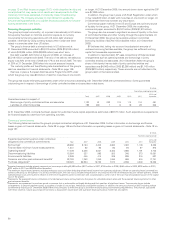
Capital expenditure and acquisitions
$million
--------------------------------------------------------------------------------------------------------------------------------------------------
2006 2005 2004
--------------------------------------------------------------------------------------------------------------------------------------------------
Exploration and Production 13,075 10,149 9,648
Refining and Marketing 3,122 2,757 2,862
Gas, Power and Renewables 432 235 530
Other businesses and corporate 281 797 770
--------------------------------------------------------------------------------------------------------------------------------------------------
Capital expenditure 16,910 13,938 13,810
Acquisitions and asset exchanges 321 211 2,841
--------------------------------------------------------------------------------------------------------------------------------------------------
17,231 14,149 16,651
Disposals (6,254) (11,200) (4,961)
--------------------------------------------------------------------------------------------------------------------------------------------------
Net investment 10,977 2,949 11,690
Capital expenditure and acquisitions in 2006, 2005 and 2004 amounted to
$17,231 million, $14,149 million and $16,651 million respectively. There
were no significant acquisitions in 2006 or 2005. Acquisitions during 2004
included $1,354 million for including TNK’s interest in Slavneft within
TNK-BP and $1,355 million for the acquisition of Solvay’s interests in BP
Solvay Polyethylene Europe and BP Solvay Polyethylene North America.
Excluding acquisitions and asset exchanges, capital expenditure for
2006 was $16,910 million compared with $13,938 million in 2005 and
$13,810 million in 2004. In 2006, this included $1 billion in respect of
our investment in Rosneft.
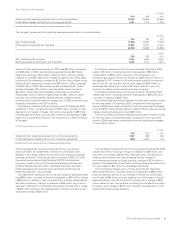
Finance costs and other finance expense
Finance costs comprises group interest less amounts capitalized. Finance
costs for continuing operations in 2006 were $718 million compared with
$616 million in 2005 and $440 million in 2004. These amounts included a
charge of $57 million arising from early redemption of finance leases in
2005. The charge in 2006 reflected higher interest rates and costs, offset
by an increase in capitalized interest compared with 2005. Compared with
2004, the charge for 2005 also reflected higher interest rates and costs
offset by an increase in capitalized interest.
Other finance expense included net pension finance costs, the interest
accretion on provisions and the interest accretion on the deferred
consideration for the acquisition of our investment in TNK-BP. Other
finance expense for continuing operations in 2006 was a credit of
$202 million compared with charges of $145 million in 2005 and
$340 million in 2004. The decrease in 2006 compared with 2005 primarily
reflected a reduction in net pension finance costs owing to a higher return
on pension assets due to the increased market value of the pension asset
base. The decrease in 2005 compared with 2004 primarily reflected a
reduction in net pension finance costs. This was primarily due to a higher
expected return on investment driven by a higher pension fund asset
value at the start of 2005 compared with the start of 2004, while the
expected long-term rate of return was similar.
Taxation
The charge for corporate taxes for continuing operations in 2006 was
$12,331 million, compared with $9,473 million in 2005 and $7,082 million
in 2004. The effective rate was 36% in 2006, 30% in 2005 and 28% in
2004. The increase in the effective rate in 2006 compared with 2005
primarily reflected the impact of the increase in the North Sea tax rate
enacted by the UK government in July 2006 and the absence of
non-recurring benefits that were present in 2005. The increase in
the effective rate in 2005 compared with 2004 was primarily due to a
higher proportion of income in countries bearing higher tax rates,
and other factors.
BP Annual Report and Accounts 2006 49