BP 2006 Annual Report Download - page 63
Download and view the complete annual report
Please find page 63 of the 2006 BP annual report below. You can navigate through the pages in the report by either clicking on the pages listed below, or by using the keyword search tool below to find specific information within the annual report.-
 1
1 -
2
-
3
-
4
-
5
-
6
-
7
-
8
-
9
-
10
-
11
-
12
-
13
-
14
-
15
-
16
-
17
-
18
-
19
-
20
-
21
-
22
-
23
-
24
-
25
-
26
-
27
-
28
-
29
-
30
-
31
-
32
-
33
-
34
-
35
-
36
-
37
-
38
-
39
-
40
-
41
-
42
-
43
-
44
-
45
-
46
-
47
-
48
-
49
-
50
-
51
-
52
-
 53
53 -
 54
54 -
 55
55 -
 56
56 -
 57
57 -
 58
58 -
 59
59 -
 60
60 -
 61
61 -
 62
62 -
 63
63 -
 64
64 -
 65
65 -
 66
66 -
 67
67 -
 68
68 -
 69
69 -
 70
70 -
 71
71 -
 72
72 -
 73
73 -
74
-
75
-
76
-
77
-
78
-
79
-
80
-
81
-
82
-
83
-
84
-
85
-
86
-
87
-
88
-
89
-
90
-
91
-
92
-
93
-
94
-
95
-
96
-
97
-
98
-
99
-
100
-
101
-
102
-
103
-
104
-
105
-
106
-
107
-
108
-
109
-
110
-
111
-
112
-
113
-
114
-
115
-
116
-
117
-
118
-
119
-
120
-
121
-
122
-
123
-
124
-
125
-
126
-
127
-
128
-
129
-
130
-
131
-
132
-
133
-
134
-
135
-
136
-
137
-
138
-
139
-
140
-
141
-
142
-
143
-
144
-
145
-
146
-
147
-
148
-
149
-
150
-
151
-
152
-
153
-
154
-
155
-
156
-
157
-
158
-
159
-
160
-
161
-
162
-
163
-
164
-
165
-
166
-
167
-
168
-
169
-
170
-
171
-
172
-
173
-
174
-
175
-
176
-
177
-
178
-
179
-
180
-
181
-
182
-
183
-
184
-
185
-
186
-
187
-
188
-
189
-
190
-
191
-
192
-
193
-
194
-
195
-
196
-
197
-
198
-
199
-
200
-
201
-
202
-
203
-
204
-
205
-
206
-
207
-
208
-
209
-
210
-
211
-
212
-
213
-
214
-
215
-
216
-
217
-
218
-
219
-
220
-
221
-
222
-
223
-
224
-
225
-
226
-
227
-
228
 |
 |

Quantitative and qualitative disclosures
about market risk
The group is exposed to a number of different market risks arising from
its normal business activities. Market risk is the possibility that changes
in foreign currency exchange rates, interest rates, or oil and natural gas
or power prices will adversely affect the value of the group’s financial
assets, liabilities or expected future cash flows. The group has developed
policies aimed at managing the volatility inherent in certain of these
natural business exposures and in accordance with these policies the
group enters into various transactions using derivative financial and
commodity instruments (derivatives). Derivatives are contracts whose
value is derived from one or more underlying financial or commodity
instruments, indices or prices which are defined in the contract.
The group also trades derivatives in conjunction with its risk
management activities.
All derivative activity, whether for risk management or trading, is carried
out by specialist teams that have the appropriate skills, experience and
supervision. These teams are subject to close financial and management
control, meeting generally accepted industry practice and reflecting
the principles of the group of Thirty Global Derivatives Study
recommendations. Independent control functions monitor compliance
with the group’s policies. A Trading Risk Management Committee has
oversight of the quality of internal control in the group’s trading function.
The control framework includes prescribed trading limits that are
reviewed regularly by senior management, daily monitoring of risk
exposure using value-at-risk principles, marking trading exposures to
market and stress testing to assess the exposure to potentially extreme
market situations. The group’s operational, risk management and trading
activities in oil, natural gas, power and financial markets are managed
within a single integrated function that has the responsibility for ensuring
high and consistent standards of control, making investments in the
necessary systems and supporting infrastructure and providing
professional management oversight.
In market risk management and trading, conventional exchange-
traded derivatives such as futures and options are used, as well as non-
exchange-traded instruments such as ‘over-the-counter’ swaps, options
and forward contracts.
IAS 39 ‘Financial Instruments: Recognition and Measurement’ (IAS 39)
prescribes strict criteria for hedge accounting, whether as a cash flow
or fair value hedge, and requires that any derivative that does not meet
these criteria should be classified as held for trading purposes and fair
valued. BP adopted IAS 32 and IAS 39 with effect from 1 January 2005
without restating prior periods. Consequently, the group’s accounting
policy under UK GAAP has been used for 2004. The policy under UK
GAAP and the disclosures required by UK GAAP for derivative financial
instruments are shown in Financial statements – Note 37 on page 148.
Where derivatives constitute a fair value hedge, the group’s exposure
to market risk created by the derivative is offset by the opposite exposure
arising from the asset, liability or transaction being hedged. Gains and
losses relating to derivatives designated as part of a cash flow hedge are
taken to reserves and recycled through income or to the carrying value of
assets, as appropriate as the hedged item is recognized. By contrast,
where derivatives are held for trading purposes, realized and unrealized
gains and losses are recognized in the period in which they occur.
The group also has embedded derivatives classified as held for trading.
Prior to the development of an active gas trading market, UK gas
contracts were priced using a basket of available price indices, primarily
relating to oil products. Post the development of an active UK gas market,
certain contracts were entered into or renegotiated using pricing formulae
not related directly to gas prices, for example, oil product and power
prices. In these circumstances, pricing formulae have been determined
to be derivatives, embedded within the overall contractual arrangements
that are not clearly and closely related to the underlying commodity. The
resulting fair value relating to these contracts is recognized on the balance
sheet with gains or losses recognized in the income statement.
Further information about BP’s use of derivatives, their characteristics
and the IFRS accounting treatment thereof is given in Financial
statements – Note 1 and Note 36 on pages 100 and 141.
There are minor differences in the criteria for hedge accounting under
IFRS and SFAS No. 133 ‘Accounting for Derivative Instruments and
Hedging Activities’. Prior to 1 January 2005, the group did not designate
any of its derivative financial instruments as part of hedged transactions
under SFAS 133. As a result, all changes in fair value were recognized
through earnings. See Financial statements – Note 53 on page 179 for
further information.
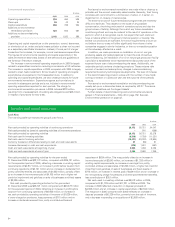
Foreign currency exchange rate risk
Fluctuations in exchange rates can have significant effects on the
group’s reported results. The effects of most exchange rate fluctuations
are absorbed in business operating results through changing cost-
competitiveness, lags in market adjustment to movements in rates and
conversion differences accounted for on specific transactions. For this
reason, the total effect of exchange rate fluctuations is not identifiable
separately in the group’s reported results.
The main underlying economic currency of the group’s cash flows
is the US dollar. This is because BP’s major product, oil, is priced
internationally in US dollars. BP’s foreign exchange management policy is
to minimize economic and material transactional exposures arising from
currency movements against the US dollar. The group co-ordinates the
handling of foreign exchange risks centrally, by netting off naturally
occurring opposite exposures wherever possible, to reduce the risks,
and then dealing with any material residual foreign exchange risks. The
most significant residual exposures are capital expenditure and UK and
European operational requirements. In addition, most of the group’s
borrowings are in US dollars or are hedged with respect to the US dollar.
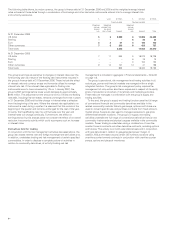
At 31 December 2006, the total of foreign currency borrowings not
swapped into US dollars amounted to $957 million. The principal elements
of this are $195 million of borrowings in euros, $179 million in Australian
dollars, $114 million in Chinese renminbi, $78 million in South African
rand, $35 million in sterling, $224 million in Canadian dollars and
$76 million in Trinidad & Tobago dollars.
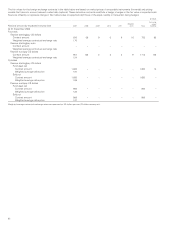
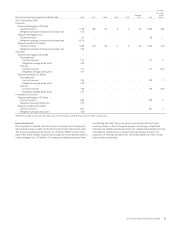
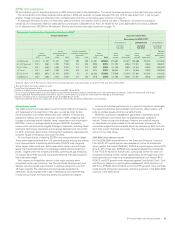
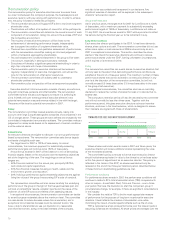
The following table provides information about the group’s foreign
currency derivative financial instruments. These include foreign currency
forward exchange agreements (forwards), cylinder option contracts
(cylinders) and purchased call options that are sensitive to changes in
the sterling/US dollar and euro/US dollar exchange rates. Where foreign
currency denominated borrowings are swapped into US dollars using
forwards or cross-currency swaps such that currency risk is completely
eliminated, neither the borrowing nor the derivative is included in
the table.
For forwards, the tables present the notional amounts and weighted
average contractual exchange rates by contractual maturity dates and
exclude forwards that have offsetting positions. Only significant forward
positions are included in the tables. The notional amounts of forwards are
translated into US dollars at the exchange rate included in the contract at
inception. The fair value represents an estimate of the gain or loss that
would be realized if the contracts were settled at the balance sheet date.
Cylinders consist of purchased call option and written put option
contracts. For cylinders and purchased call options, the tables present
the notional amounts of the option contracts at 31 December and the
weighted average strike rates.
BP Annual Report and Accounts 2006 61