BP 2006 Annual Report Download - page 153
Download and view the complete annual report
Please find page 153 of the 2006 BP annual report below. You can navigate through the pages in the report by either clicking on the pages listed below, or by using the keyword search tool below to find specific information within the annual report.-
 1
1 -
2
-
3
-
4
-
5
-
6
-
7
-
8
-
9
-
10
-
11
-
12
-
13
-
14
-
15
-
16
-
17
-
18
-
19
-
20
-
21
-
22
-
23
-
24
-
25
-
26
-
27
-
28
-
29
-
30
-
31
-
32
-
33
-
34
-
35
-
36
-
37
-
38
-
39
-
40
-
41
-
42
-
43
-
44
-
45
-
46
-
47
-
48
-
49
-
50
-
51
-
52
-
53
-
54
-
55
-
56
-
57
-
58
-
59
-
60
-
61
-
62
-
63
-
64
-
65
-
66
-
67
-
68
-
69
-
70
-
71
-
72
-
73
-
74
-
75
-
76
-
77
-
78
-
79
-
80
-
81
-
82
-
83
-
84
-
85
-
86
-
87
-
88
-
89
-
90
-
91
-
92
-
93
-
94
-
95
-
96
-
97
-
98
-
99
-
100
-
101
-
102
-
103
-
104
-
105
-
106
-
107
-
108
-
109
-
110
-
111
-
112
-
113
-
114
-
115
-
116
-
117
-
118
-
119
-
120
-
121
-
122
-
123
-
124
-
125
-
126
-
127
-
128
-
129
-
130
-
131
-
132
-
133
-
134
-
135
-
136
-
137
-
138
-
139
-
140
-
141
-
142
-
 143
143 -
 144
144 -
 145
145 -
 146
146 -
 147
147 -
 148
148 -
 149
149 -
 150
150 -
 151
151 -
 152
152 -
 153
153 -
 154
154 -
 155
155 -
 156
156 -
 157
157 -
 158
158 -
 159
159 -
 160
160 -
 161
161 -
 162
162 -
 163
163 -
164
-
165
-
166
-
167
-
168
-
169
-
170
-
171
-
172
-
173
-
174
-
175
-
176
-
177
-
178
-
179
-
180
-
181
-
182
-
183
-
184
-
185
-
186
-
187
-
188
-
189
-
190
-
191
-
192
-
193
-
194
-
195
-
196
-
197
-
198
-
199
-
200
-
201
-
202
-
203
-
204
-
205
-
206
-
207
-
208
-
209
-
210
-
211
-
212
-
213
-
214
-
215
-
216
-
217
-
218
-
219
-
220
-
221
-
222
-
223
-
224
-
225
-
226
-
227
-
228
 |
 |

BP Annual Report and Accounts 2006 151
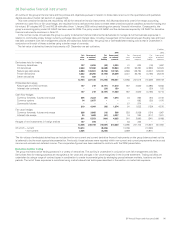
38 Finance debt continued
Finance leases
The group uses finance leases to acquire property, plant and equipment. These leases have terms of renewal but no purchase options and escalation
clauses. Renewals are at the option of the lessee. Future minimum lease payments under finance leases are set out below.
$ million
------------------------------------------------------------------------------------------------------------------------------------------------------------------------------------------------------------------------------------------------------------------------------------------------------------
2006 2005
------------------------------------------------------------------------------------------------------------------------------------------------------------------------------------------------------------------------------------------------------------------------------------------------------------
Minimum future lease payments payable within
1year 82 78
2 to 5 years 376 320
Thereafter 873 838
------------------------------------------------------------------------------------------------------------------------------------------------------------------------------------------------------------------------------------------------------------------------------------------------------------
1,331 1,236
Less finance charges 516 455
------------------------------------------------------------------------------------------------------------------------------------------------------------------------------------------------------------------------------------------------------------------------------------------------------------
Net obligations 815 781
Of which – payable within 1 year 60 60
– payable within 2 to 5 years 164 133
– payable thereafter 591 588
Fair values
For 2006, the estimated fair value of finance debt is shown in the table below together with the carrying amount as reflected in the balance sheet.
Long-term borrowings in the table below include the portion of debt that matures in the year from 31 December 2006, whereas in the balance sheet
the amount would be reported under current liabilities. Long-term borrowings also include US Industrial Revenue/Municipal Bonds and loans associated
with long-term gas supply contracts classified on the balance sheet as current liabilities.
The carrying value of the group’s short-term borrowings, comprising mainly commercial paper, bank loans and overdrafts, approximates their fair
value. The fair value of the group’s long-term borrowings and finance lease obligations is estimated using quoted prices or, where these are not
available, discounted cash flow analyses based on the group’s current incremental borrowing rates for similar types and maturities of borrowing.
$ million
------------------------------------------------------------------------------------------------------------------------------------------------------------------------------------------------------------------------------------------------------------------------------------------------------------
2006 2005
------------------------------------------------------------------------------------------------------------------------------------------------------------------------------------------------------------------------------------------------------------------------------------------------------------
Fair value
Carrying
amount Fair value
Carrying
amount
------------------------------------------------------------------------------------------------------------------------------------------------------------------------------------------------------------------------------------------------------------------------------------------------------------
Short-term borrowings 7,040 7,040 3,297 3,297
Long-term borrowings 16,201 16,155 15,313 15,084
Net obligations under finance leases 832 815 803 781
------------------------------------------------------------------------------------------------------------------------------------------------------------------------------------------------------------------------------------------------------------------------------------------------------------
Total finance debt 24,073 24,010 19,413 19,162
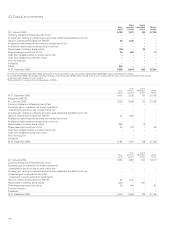
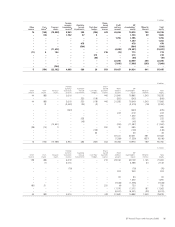
39 Analysis of changes in net debt
Net debt is current and non-current finance debt less cash and cash equivalents. The net debt ratio is the ratio of net debt to net debt plus total equity.
The net debt ratio at 31 December 2006 was 20% (2005 17%).
$ million
------------------------------------------------------------------------------------------------------------------------------------------------------------------------------------------------------------------------------------------------------------------------------------------------------------
2006 2005
------------------------------------------------------------------------------------------------------------------------------------------------------------------------------------------------------------------------------------------------------------------------------------------------------------
Movement in net debt Finance
debt
Cash and
cash
equivalents
Net
debt
Finance
debt
Cash and
cash
equivalents
Net
debt
------------------------------------------------------------------------------------------------------------------------------------------------------------------------------------------------------------------------------------------------------------------------------------------------------------
At 1 January (19,162) 2,960 (16,202) (23,091) 1,359 (21,732)
Adoption of IAS 39 –––(147) – (147)
------------------------------------------------------------------------------------------------------------------------------------------------------------------------------------------------------------------------------------------------------------------------------------------------------------
Restated (19,162) 2,960 (16,202) (23,238) 1,359 (21,879)
Exchange adjustments (172) 47 (125) (44) (88) (132)
Debt acquired (13) – (13) –––
Net cash flow (4,049) (417) (4,466) 3,803 1,689 5,492
Fair value hedge adjustment (581) – (581) 171 – 171
Other movements (33) – (33) 146 – 146
------------------------------------------------------------------------------------------------------------------------------------------------------------------------------------------------------------------------------------------------------------------------------------------------------------
At 31 December (24,010) 2,590 (21,420) (19,162) 2,960 (16,202)
Equity 85,465 80,765