BP 2006 Annual Report Download - page 18
Download and view the complete annual report
Please find page 18 of the 2006 BP annual report below. You can navigate through the pages in the report by either clicking on the pages listed below, or by using the keyword search tool below to find specific information within the annual report.-
 1
1 -
2
-
3
-
4
-
5
-
6
-
7
-
 8
8 -
 9
9 -
 10
10 -
 11
11 -
 12
12 -
 13
13 -
 14
14 -
 15
15 -
 16
16 -
 17
17 -
 18
18 -
 19
19 -
 20
20 -
 21
21 -
 22
22 -
 23
23 -
 24
24 -
 25
25 -
 26
26 -
 27
27 -
 28
28 -
29
-
30
-
31
-
32
-
33
-
34
-
35
-
36
-
37
-
38
-
39
-
40
-
41
-
42
-
43
-
44
-
45
-
46
-
47
-
48
-
49
-
50
-
51
-
52
-
53
-
54
-
55
-
56
-
57
-
58
-
59
-
60
-
61
-
62
-
63
-
64
-
65
-
66
-
67
-
68
-
69
-
70
-
71
-
72
-
73
-
74
-
75
-
76
-
77
-
78
-
79
-
80
-
81
-
82
-
83
-
84
-
85
-
86
-
87
-
88
-
89
-
90
-
91
-
92
-
93
-
94
-
95
-
96
-
97
-
98
-
99
-
100
-
101
-
102
-
103
-
104
-
105
-
106
-
107
-
108
-
109
-
110
-
111
-
112
-
113
-
114
-
115
-
116
-
117
-
118
-
119
-
120
-
121
-
122
-
123
-
124
-
125
-
126
-
127
-
128
-
129
-
130
-
131
-
132
-
133
-
134
-
135
-
136
-
137
-
138
-
139
-
140
-
141
-
142
-
143
-
144
-
145
-
146
-
147
-
148
-
149
-
150
-
151
-
152
-
153
-
154
-
155
-
156
-
157
-
158
-
159
-
160
-
161
-
162
-
163
-
164
-
165
-
166
-
167
-
168
-
169
-
170
-
171
-
172
-
173
-
174
-
175
-
176
-
177
-
178
-
179
-
180
-
181
-
182
-
183
-
184
-
185
-
186
-
187
-
188
-
189
-
190
-
191
-
192
-
193
-
194
-
195
-
196
-
197
-
198
-
199
-
200
-
201
-
202
-
203
-
204
-
205
-
206
-
207
-
208
-
209
-
210
-
211
-
212
-
213
-
214
-
215
-
216
-
217
-
218
-
219
-
220
-
221
-
222
-
223
-
224
-
225
-
226
-
227
-
228
 |
 |

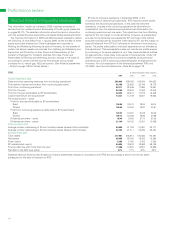
Exploration and production
Our Exploration and Production business includes upstream and
midstream activities in 26 countries, including the US, the UK, Angola,
Azerbaijan, Canada, Egypt, Russia, Trinidad & Tobago (Trinidad) and
locations within Asia Pacific, Latin America and the Middle East.
Upstream activities involve oil and natural gas exploration and field
development and production. Our exploration programme is currently
focused around the deepwater Gulf of Mexico, Angola, Egypt, Russia and
Algeria. Major development areas include the deepwater Gulf of Mexico,
Azerbaijan, Algeria, Angola, Egypt and Asia Pacific. During 2006,
production came from 22 countries. The principal areas of production are
Russia, the US, Trinidad, the UK, Latin America, the Middle East, Asia
Pacific, Azerbaijan, Angola and Egypt.
Midstream activities involve the ownership and management of crude
oil and natural gas pipelines, processing and export terminals and LNG
processing facilities and transportation. Our most significant midstream
pipeline interests include the Trans Alaska Pipeline System, the Forties
Pipeline System and the Central Area Transmission System pipeline, both
in the UK sector of the North Sea, and the Baku-Tbilisi-Ceyhan pipeline,
running through Azerbaijan, Georgia and Turkey. Major LNG activities are
located in Trinidad, Indonesia and Australia. Further LNG businesses with
BP involvement are being built up in Egypt and Angola.
Our oil and gas production assets are located onshore or offshore and
include wells, gathering centres, in-field flow lines, processing facilities,
storage facilities, offshore platforms, export systems (e.g. transit lines),
pipelines and LNG plant facilities.
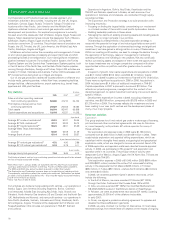
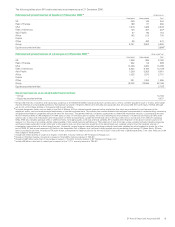
Key statistics $million
--------------------------------------------------------------------------------------------------------------------------------------------------
2006 2005a2004a
--------------------------------------------------------------------------------------------------------------------------------------------------
Sales and other operating revenues
from continuing operations 52,600 47,210 34,700
Profit before interest and tax from
continuing operations 29,629 25,502 18,085
Total assets 99,310 93,447 85,808
Capital expenditure and acquisitions 13,118 10,237 11,002
$ per barrel
--------------------------------------------------------------------------------------------------------------------------------------------------
Average BP crude oil realizationsb61.91 50.27 36.45
Average BP NGL realizationsb37.17 33.23 26.75
Average BP liquids realizationsbc 59.23 48.51 35.39
Average West Texas Intermediate
oil price 66.02 56.58 41.49
Average Brent oil price 65.14 54.48 38.27
$ per thousand cubic feet
--------------------------------------------------------------------------------------------------------------------------------------------------
Average BP natural gas realizationsb4.72 4.90 3.86
Average BP US natural gas realizationsb5.74 6.78 5.11
$ per mmBtu
--------------------------------------------------------------------------------------------------------------------------------------------------
Average Henry Hub gas priced7.24 8.65 6.13
Profit before interest and tax from continuing operations includes profit after interest
and tax of equity-accounted entities.
aWith effect from 1 January 2006, we transferred the Phu My Phase 3 combined
cycle gas turbine plant in Vietnam to the Gas, Power and Renewables segment.
The 2005 and 2004 data above has been restated to reflect this transfer.
bThe Exploration and Production business does not undertake any hedging activity.
Consequently, realizations reflect the market price achieved. Realizations are based
on sales of consolidated subsidiaries only – this excludes equity-accounted entities.
cCrude oil and natural gas liquids.
dHenry Hub First of Month Index.
Our activities are divided among existing profit centres – our operations in
Alaska, Egypt, Latin America (including Argentina, Bolivia, Colombia
and Venezuela), Middle East (including Abu Dhabi, India, Sharjah and
Pakistan), North America Gas (onshore US and Canada) and the North Sea
(UK, Netherlands and Norway); and new profit centres – our operations in
Asia Pacific (Australia, Vietnam, Indonesia and China), Azerbaijan, North
Africa (Algeria), Angola, Trinidad and the deepwater Gulf of Mexico; and
Russia/Kazakhstan (this includes our operations in TNK-BP, Sakhalin
and LukArco).
Operations in Argentina, Bolivia, Abu Dhabi, Kazakhstan and the
TNK-BP and Sakhalin operations in Russia, as well as some of our
operations in Indonesia and Venezuela, are conducted through equity-
accounted entities.
The Exploration and Production strategy is to build production with
improving returns by:
– Focusing on finding the largest fields, concentrating our involvement
in a limited number of the world’s most prolific hydrocarbon basins.
– Building leadership positions in these areas.
– Managing the decline of existing producing assets and divesting assets
when they no longer compete in our portfolio.
This strategy is underpinned by a focused exploration strategy in
areas with the potential for large oil and natural gas fields as new profit
centres. Through the application of advanced technology and significant
investment, we have gained a strong position in many of these areas.
Within our existing profit centres, we seek to manage the decline through
the application of technology, reservoir management, maintaining
operating efficiency and investing in new projects. We also continually
review our existing assets and dispose of them when the opportunities
for future investment are no longer competitive compared with other
opportunities within our portfolio and offer greater value to another
operator.
In support of growth, total capital expenditure and acquisitions in 2006
was $13.1 billion (2005 $10.2 billion and 2004 $11.0 billion). Capital
expenditure in 2006 included our investment in Rosneft’s IPO of $1 billion.
There were no significant acquisitions in 2006 or 2005. Acquisitions in
2004 included some $1.4 billion of additional investment in TNK-BP.
Capital expenditure in 2007 is planned to be around $13 billion. This
reflects our project programme, managed within the context of our
disciplined approach to capital investment and taking into account sector-
specific inflation.
Development expenditure incurred in 2006, excluding midstream
activities, was $9,109 million, compared with $7,678 million in 2005 and
$7,270 million in 2004. This increase reflects the investment we have
been making in our new profit centres and the development phase of
many of our major projects.
Upstream activities
Exploration
The group explores for oil and natural gas under a wide range of licensing,
joint venture and other contractual agreements. We may do this alone
or, more frequently, with partners. BP acts as operator for many of
these ventures.
Our exploration and appraisal costs in 2006 were $1,765 million,
compared with $1,266 million in 2005 and $1,039 million in 2004. These
costs include exploration and appraisal drilling expenditures, which are
capitalized within intangible fixed assets, and geological and geophysical
exploration costs, which are charged to income as incurred. About 41%
of 2006 exploration and appraisal costs were directed towards appraisal
activity. In 2006, we participated in 85 gross (37 net) exploration and
appraisal wells in 14 countries. The principal areas of activity were
deepwater Gulf of Mexico, Angola, Egypt, the UK North Sea, Trinidad and
Russia (outside TNK-BP).
Total exploration expense in 2006 of $1,045 million (2005 $684 million
and2004$637million)includedthewrite-offofunsuccessfuldrilling
activity in the deepwater Gulf of Mexico ($343 million), in Trinidad
($85 million), in Turkey ($80 million), onshore North America ($44 million)
andothers($16million).
In 2006, we obtained upstream rights in several new tracts, which
include the following:
– In the Gulf of Mexico, we were awarded 101 blocks (BP 100%)
through the Outer Continental Shelf Lease Sales 198 and 200.
– In India, we were awarded (BP 100%) the Coal Bed Methane block
BB-CBM-2005/III located in the Birbhum district of West Bengal.
– In Pakistan, we were awarded three new blocks (BP 100%), covering
approximately 20,000 km
2
of the offshore Indus delta.
In early 2007:
– In Oman, we signed a production-sharing agreement to appraise and
develop the Khazzan/Makarem gas fields.
In 2006, we were involved in a number of discoveries. In most cases,
reserves bookings from these fields will depend on the results of ongoing
16