BP 2006 Annual Report Download - page 148
Download and view the complete annual report
Please find page 148 of the 2006 BP annual report below. You can navigate through the pages in the report by either clicking on the pages listed below, or by using the keyword search tool below to find specific information within the annual report.-
 1
1 -
2
-
3
-
4
-
5
-
6
-
7
-
8
-
9
-
10
-
11
-
12
-
13
-
14
-
15
-
16
-
17
-
18
-
19
-
20
-
21
-
22
-
23
-
24
-
25
-
26
-
27
-
28
-
29
-
30
-
31
-
32
-
33
-
34
-
35
-
36
-
37
-
38
-
39
-
40
-
41
-
42
-
43
-
44
-
45
-
46
-
47
-
48
-
49
-
50
-
51
-
52
-
53
-
54
-
55
-
56
-
57
-
58
-
59
-
60
-
61
-
62
-
63
-
64
-
65
-
66
-
67
-
68
-
69
-
70
-
71
-
72
-
73
-
74
-
75
-
76
-
77
-
78
-
79
-
80
-
81
-
82
-
83
-
84
-
85
-
86
-
87
-
88
-
89
-
90
-
91
-
92
-
93
-
94
-
95
-
96
-
97
-
98
-
99
-
100
-
101
-
102
-
103
-
104
-
105
-
106
-
107
-
108
-
109
-
110
-
111
-
112
-
113
-
114
-
115
-
116
-
117
-
118
-
119
-
120
-
121
-
122
-
123
-
124
-
125
-
126
-
127
-
128
-
129
-
130
-
131
-
132
-
133
-
134
-
135
-
136
-
137
-
 138
138 -
 139
139 -
 140
140 -
 141
141 -
 142
142 -
 143
143 -
 144
144 -
 145
145 -
 146
146 -
 147
147 -
 148
148 -
 149
149 -
 150
150 -
 151
151 -
 152
152 -
 153
153 -
 154
154 -
 155
155 -
 156
156 -
 157
157 -
 158
158 -
159
-
160
-
161
-
162
-
163
-
164
-
165
-
166
-
167
-
168
-
169
-
170
-
171
-
172
-
173
-
174
-
175
-
176
-
177
-
178
-
179
-
180
-
181
-
182
-
183
-
184
-
185
-
186
-
187
-
188
-
189
-
190
-
191
-
192
-
193
-
194
-
195
-
196
-
197
-
198
-
199
-
200
-
201
-
202
-
203
-
204
-
205
-
206
-
207
-
208
-
209
-
210
-
211
-
212
-
213
-
214
-
215
-
216
-
217
-
218
-
219
-
220
-
221
-
222
-
223
-
224
-
225
-
226
-
227
-
228
 |
 |

146
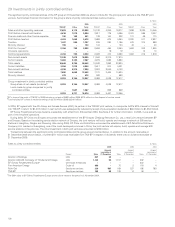
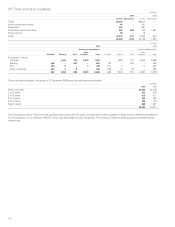
36 Derivative financial instruments continued
$ million
------------------------------------------------------------------------------------------------------------------------------------------------------------------------------------------------------------------------------------------------------------------------------------------------------------
2005
------------------------------------------------------------------------------------------------------------------------------------------------------------------------------------------------------------------------------------------------------------------------------------------------------------
Less than
1 year 1-2 years 2-3 years 3-4 years 4-5 years
Over
5 years Total
------------------------------------------------------------------------------------------------------------------------------------------------------------------------------------------------------------------------------------------------------------------------------------------------------------
Natural gas and LNG embedded derivatives
Fair value 330 176 76 5 – – 587
Notional value 425 484 465 450 429 2,367 4,620
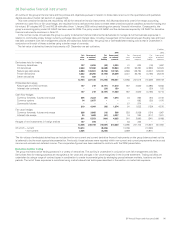
Embedded derivative liabilities have the following fair values, contractual or notional values and maturities.
$ million
------------------------------------------------------------------------------------------------------------------------------------------------------------------------------------------------------------------------------------------------------------------------------------------------------------
2006
------------------------------------------------------------------------------------------------------------------------------------------------------------------------------------------------------------------------------------------------------------------------------------------------------------
Less than
1 year 1-2 years 2-3 years 3-4 years 4-5 years
Over
5 years Total
------------------------------------------------------------------------------------------------------------------------------------------------------------------------------------------------------------------------------------------------------------------------------------------------------------
Natural gas and LNG embedded derivatives
Fair value (444) (433) (320) (218) (186) (570) (2,171)
Notional value 1,352 1,229 1,279 1,278 1,249 5,423 11,810
Interest rate embedded derivatives
Fair value –(26)––––(26)
Notional value –150––––150
$ million
------------------------------------------------------------------------------------------------------------------------------------------------------------------------------------------------------------------------------------------------------------------------------------------------------------
2005
------------------------------------------------------------------------------------------------------------------------------------------------------------------------------------------------------------------------------------------------------------------------------------------------------------
Less than
1 year 1-2 years 2-3 years 3-4 years 4-5 years
Over
5 years Total
------------------------------------------------------------------------------------------------------------------------------------------------------------------------------------------------------------------------------------------------------------------------------------------------------------
Natural gas and LNG embedded derivatives
Fair value (953) (703) (472) (237) (180) (553) (3,098)
Notional value 740 870 1,097 832 767 4,257 8,563
Interest rate embedded derivatives
Fair value – – (30) – – – (30)
Notional value ––150–––150
The following tables show the net fair value of embedded derivatives at 31 December analysed by maturity period and by methodology of fair value
estimation.
$ million
------------------------------------------------------------------------------------------------------------------------------------------------------------------------------------------------------------------------------------------------------------------------------------------------------------
2006
------------------------------------------------------------------------------------------------------------------------------------------------------------------------------------------------------------------------------------------------------------------------------------------------------------
Less than
1 year 1-2 years 2-3 years 3-4 years 4-5 years
Over
5 years Total
------------------------------------------------------------------------------------------------------------------------------------------------------------------------------------------------------------------------------------------------------------------------------------------------------------
Prices actively quoted –––––––
Prices sourced from observable data or market corroboration 4958––––107
Prices based on models and other valuation methods (444) (459) (320) (218) (186) (570) (2,197)
------------------------------------------------------------------------------------------------------------------------------------------------------------------------------------------------------------------------------------------------------------------------------------------------------------
(395) (401) (320) (218) (186) (570) (2,090)
$ million
------------------------------------------------------------------------------------------------------------------------------------------------------------------------------------------------------------------------------------------------------------------------------------------------------------
2005
------------------------------------------------------------------------------------------------------------------------------------------------------------------------------------------------------------------------------------------------------------------------------------------------------------
Less than
1 year 1-2 years 2-3 years 3-4 years 4-5 years
Over
5 years Total
------------------------------------------------------------------------------------------------------------------------------------------------------------------------------------------------------------------------------------------------------------------------------------------------------------
Prices actively quoted –––––––
Prices sourced from observable data or market corroboration 5128––––79
Prices based on models and other valuation methods (674) (542) (426) (231) (182) (565) (2,620)
------------------------------------------------------------------------------------------------------------------------------------------------------------------------------------------------------------------------------------------------------------------------------------------------------------
(623) (514) (426) (231) (182) (565) (2,541)
The net change in fair value of contracts based on models and other valuation methods during the year is a gain of $423 million (2005 loss of
$1,773 million).
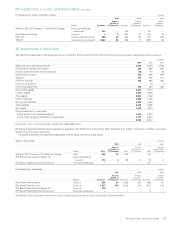
Sensitivity analysis
Detailed below for the natural gas embedded derivatives is a sensitivity of the fair value to immediate 10% favourable and adverse changes in the key
assumptions.
At 31 December 2006 At 31 December 2005
------------------------------------------------------------------------------------------------------------------------------------------------------------------------------------------------------------------------------------------------------------------------------------------------------------
Remaining contract terms 2to12years 3 to 13 years
Contractual / notional amount 4,968 million therms 8,220 million therms
Discount rate – nominal risk free 4.5% 4.5%
Fair value asset (liability) $(2,171) million $(2,590) million