BP 2006 Annual Report Download - page 154
Download and view the complete annual report
Please find page 154 of the 2006 BP annual report below. You can navigate through the pages in the report by either clicking on the pages listed below, or by using the keyword search tool below to find specific information within the annual report.-
 1
1 -
2
-
3
-
4
-
5
-
6
-
7
-
8
-
9
-
10
-
11
-
12
-
13
-
14
-
15
-
16
-
17
-
18
-
19
-
20
-
21
-
22
-
23
-
24
-
25
-
26
-
27
-
28
-
29
-
30
-
31
-
32
-
33
-
34
-
35
-
36
-
37
-
38
-
39
-
40
-
41
-
42
-
43
-
44
-
45
-
46
-
47
-
48
-
49
-
50
-
51
-
52
-
53
-
54
-
55
-
56
-
57
-
58
-
59
-
60
-
61
-
62
-
63
-
64
-
65
-
66
-
67
-
68
-
69
-
70
-
71
-
72
-
73
-
74
-
75
-
76
-
77
-
78
-
79
-
80
-
81
-
82
-
83
-
84
-
85
-
86
-
87
-
88
-
89
-
90
-
91
-
92
-
93
-
94
-
95
-
96
-
97
-
98
-
99
-
100
-
101
-
102
-
103
-
104
-
105
-
106
-
107
-
108
-
109
-
110
-
111
-
112
-
113
-
114
-
115
-
116
-
117
-
118
-
119
-
120
-
121
-
122
-
123
-
124
-
125
-
126
-
127
-
128
-
129
-
130
-
131
-
132
-
133
-
134
-
135
-
136
-
137
-
138
-
139
-
140
-
141
-
142
-
143
-
 144
144 -
 145
145 -
 146
146 -
 147
147 -
 148
148 -
 149
149 -
 150
150 -
 151
151 -
 152
152 -
 153
153 -
 154
154 -
 155
155 -
 156
156 -
 157
157 -
 158
158 -
 159
159 -
 160
160 -
 161
161 -
 162
162 -
 163
163 -
 164
164 -
165
-
166
-
167
-
168
-
169
-
170
-
171
-
172
-
173
-
174
-
175
-
176
-
177
-
178
-
179
-
180
-
181
-
182
-
183
-
184
-
185
-
186
-
187
-
188
-
189
-
190
-
191
-
192
-
193
-
194
-
195
-
196
-
197
-
198
-
199
-
200
-
201
-
202
-
203
-
204
-
205
-
206
-
207
-
208
-
209
-
210
-
211
-
212
-
213
-
214
-
215
-
216
-
217
-
218
-
219
-
220
-
221
-
222
-
223
-
224
-
225
-
226
-
227
-
228
 |
 |

152
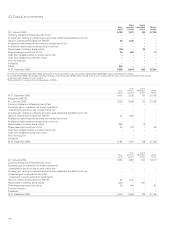
40 Provisions
$ million
------------------------------------------------------------------------------------------------------------------------------------------------------------------------------------------------------------------------------------------------------------------------------------------------------------
Decommissioning Environmental
Litigation
and other Total
------------------------------------------------------------------------------------------------------------------------------------------------------------------------------------------------------------------------------------------------------------------------------------------------------------
At 1 January 2006 6,450 2,311 2,295 11,056
Exchange adjustments 13 31 44 88
New or increased provisions 2,142 423 2,111 4,676
Write-back of unused provisions – (355) (270) (625)
Unwinding of discount 153 45 47 245
Utilization (179) (324) (1,068) (1,571)
Deletions (214) (4) (7) (225)
------------------------------------------------------------------------------------------------------------------------------------------------------------------------------------------------------------------------------------------------------------------------------------------------------------
At 31 December 2006 8,365 2,127 3,152 13,644
Of which – expected to be incurred within 1 year 324 444 1,164 1,932
– expected to be incurred in more than 1 year 8,041 1,683 1,988 11,712
$ million
------------------------------------------------------------------------------------------------------------------------------------------------------------------------------------------------------------------------------------------------------------------------------------------------------------
Decommissioning Environmental
Litigation
and other Total
------------------------------------------------------------------------------------------------------------------------------------------------------------------------------------------------------------------------------------------------------------------------------------------------------------
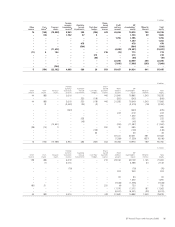
At 1 January 2005 5,572 2,457 1,570 9,599
Exchange adjustments (38) (32) (35) (105)
New or increased provisions 1,023 565 1,464 3,052
Write-back of unused provisions – (335) (86) (421)
Unwinding of discount 122 47 32 201
Utilization (128) (366) (650) (1,144)
Deletions (101) (25) – (126)
------------------------------------------------------------------------------------------------------------------------------------------------------------------------------------------------------------------------------------------------------------------------------------------------------------
At 31 December 2005 6,450 2,311 2,295 11,056
Of which – expected to be incurred within 1 year 162 489 451 1,102
– expected to be incurred in more than 1 year 6,288 1,822 1,844 9,954
The group makes full provision for the future cost of decommissioning oil and natural gas production facilities and related pipelines on a discounted
basis on the installation of those facilities. The provision for the costs of decommissioning these production facilities and pipelines at the end of their
economic lives has been estimated using existing technology, at current prices and discounted using a real discount rate of 2.0% (2005 2.0%). These
costs are expected to be incurred over the next 30 years. While the provision is based on the best estimate of future costs and the economic lives of
the facilities and pipelines, there is uncertainty regarding both the amount and timing of incurring these costs.
Provisions for environmental remediation are made when a clean-up is probable and the amount reasonably determinable. Generally, this coincides
with commitment to a formal plan of action or, if earlier, on divestment or closure of inactive sites. The provision for environmental liabilities has been
estimated using existing technology, at current prices and discounted using a real discount rate of 2.0% (2005 2.0%). The majority of these costs are
expected to be incurred over the next 10 years. The extent and cost of future remediation programmes are inherently difficult to estimate. They depend
on the scale of any possible contamination, the timing and extent of corrective actions, and also the group’s share of liability.
The group also holds provisions for litigation, expected rental shortfalls on surplus properties, and sundry other liabilities. Included within thenew
or increased provisions made for 2006 is an amount of $925 million (2005 $700 million) in respect of the Texas City incident of which a total of
$1,355 million has been disbursed to claimants ($863 million in 2006 and $492 million in 2005).
To the extent that these liabilities are not expected to be settled within the next three years, the provisions are discounted using either a nominal
discount rate of 4.5% (2005 4.5%) or a real discount rate of 2.0% (2005 2.0%), as appropriate.
41 Pensions and other post-retirement benefits
Most group companies have pension plans, the forms and benefits of which vary with conditions and practices in the countries concerned. Pension
benefits may be provided through defined contribution plans (money purchase schemes) or defined benefit plans (final salary and other types of
schemes with committed pension payments). For defined contribution plans, retirement benefits are determined by the value of funds arising from
contributions paid in respect of each employee. For defined benefit plans, retirement benefits are based on such factors as the employees’ pensionable
salary and length of service. Defined benefit plans may be externally funded or unfunded. The assets of funded plans are generally held in separately
administered trusts.
In particular, in the UK the primary pension arrangement is a funded final salary pension plan which remains open to new employees. Retired
employees draw the majority of their benefit as an annuity.
In the US, a range of retirement arrangements are provided. These include a funded final salary pension plan for certain heritage employees and a
cash balance arrangement for new hires. Retired US employees typically take their pension benefit in the form of a lump sum payment. US employees
are also eligible to participate in a defined contribution (401k) plan in which employee contributions are matched with company contributions.
Contributions to funded defined benefit plans are based on advice from independent actuaries using actuarial methods, the objective of which is
to provide adequate funds to meet pension obligations as they fall due. During 2006, contributions of $438 million (2005 $340 million and 2004
$249 million) and $181 million (2005 $279 million and 2004 $30 million) were made to the UK plans and US plans respectively. In addition, contributions
of $136 million (2005 $140 million and 2004 $116 million) were made to other funded defined benefit plans. The aggregate level of contributions in 2007
is expected to be approximately $750 million.
Certain group companies, principally in the US, provide post-retirement healthcare and life insurance benefits to their retired employees and
dependants. The entitlement to these benefits is usually based on the employee remaining in service until retirement age and completion of a minimum
period of service. The plans are funded to a limited extent.
The cost of providing pensions and other post-retirement benefits is assessed annually by independent actuaries using the projected unit credit
method. The date of the most recent actuarial review was 31 December 2006.