BP 2006 Annual Report Download - page 116
Download and view the complete annual report
Please find page 116 of the 2006 BP annual report below. You can navigate through the pages in the report by either clicking on the pages listed below, or by using the keyword search tool below to find specific information within the annual report.-
 1
1 -
2
-
3
-
4
-
5
-
6
-
7
-
8
-
9
-
10
-
11
-
12
-
13
-
14
-
15
-
16
-
17
-
18
-
19
-
20
-
21
-
22
-
23
-
24
-
25
-
26
-
27
-
28
-
29
-
30
-
31
-
32
-
33
-
34
-
35
-
36
-
37
-
38
-
39
-
40
-
41
-
42
-
43
-
44
-
45
-
46
-
47
-
48
-
49
-
50
-
51
-
52
-
53
-
54
-
55
-
56
-
57
-
58
-
59
-
60
-
61
-
62
-
63
-
64
-
65
-
66
-
67
-
68
-
69
-
70
-
71
-
72
-
73
-
74
-
75
-
76
-
77
-
78
-
79
-
80
-
81
-
82
-
83
-
84
-
85
-
86
-
87
-
88
-
89
-
90
-
91
-
92
-
93
-
94
-
95
-
96
-
97
-
98
-
99
-
100
-
101
-
102
-
103
-
104
-
105
-
 106
106 -
 107
107 -
 108
108 -
 109
109 -
 110
110 -
 111
111 -
 112
112 -
 113
113 -
 114
114 -
 115
115 -
 116
116 -
 117
117 -
 118
118 -
 119
119 -
 120
120 -
 121
121 -
 122
122 -
 123
123 -
 124
124 -
 125
125 -
 126
126 -
127
-
128
-
129
-
130
-
131
-
132
-
133
-
134
-
135
-
136
-
137
-
138
-
139
-
140
-
141
-
142
-
143
-
144
-
145
-
146
-
147
-
148
-
149
-
150
-
151
-
152
-
153
-
154
-
155
-
156
-
157
-
158
-
159
-
160
-
161
-
162
-
163
-
164
-
165
-
166
-
167
-
168
-
169
-
170
-
171
-
172
-
173
-
174
-
175
-
176
-
177
-
178
-
179
-
180
-
181
-
182
-
183
-
184
-
185
-
186
-
187
-
188
-
189
-
190
-
191
-
192
-
193
-
194
-
195
-
196
-
197
-
198
-
199
-
200
-
201
-
202
-
203
-
204
-
205
-
206
-
207
-
208
-
209
-
210
-
211
-
212
-
213
-
214
-
215
-
216
-
217
-
218
-
219
-
220
-
221
-
222
-
223
-
224
-
225
-
226
-
227
-
228
 |
 |

114
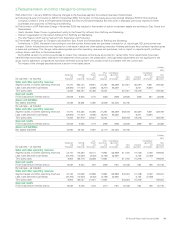
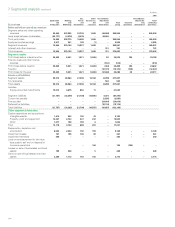
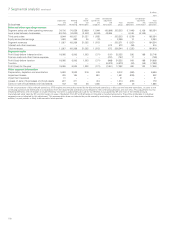
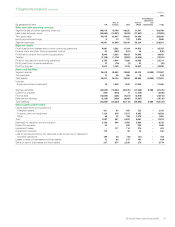
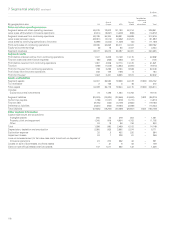
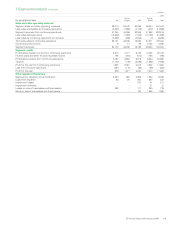
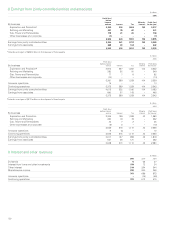
7 Segmental analysis continued
$ million
------------------------------------------------------------------------------------------------------------------------------------------------------------------------------------------------------------------------------------------------------------------------------------------------------------
2006
------------------------------------------------------------------------------------------------------------------------------------------------------------------------------------------------------------------------------------------------------------------------------------------------------------
By business
Exploration
and
Production
Refining
and
Marketing
Gas,
Power
and
Renewables
Other
businessess
and
corporate
Consolidation
adjustment
and
eliminations
Total
group
Innovene
operations
Consolidation
adjustment
and
eliminationsa
Total
continuing
operations
------------------------------------------------------------------------------------------------------------------------------------------------------------------------------------------------------------------------------------------------------------------------------------------------------------
Sales and other operating revenues
Segment sales and other operating
revenues 52,600 232,855 23,708 1,009 (44,266) 265,906 – – 265,906
Less: sales between businesses (36,171)(4,076)(4,019)–44,266––––
------------------------------------------------------------------------------------------------------------------------------------------------------------------------------------------------------------------------------------------------------------------------------------------------------------
Third party sales 16,429 228,779 19,689 1,009 – 265,906 – – 265,906
Equity-accounted earnings 3,517 341 138 (1) – 3,995 – – 3,995
------------------------------------------------------------------------------------------------------------------------------------------------------------------------------------------------------------------------------------------------------------------------------------------------------------
Segment revenues 19,946 229,120 19,827 1,008 – 269,901 – – 269,901
Interest and other revenues ––––701701––701
------------------------------------------------------------------------------------------------------------------------------------------------------------------------------------------------------------------------------------------------------------------------------------------------------------
Total revenues 19,946 229,120 19,827 1,008 701 270,602 – – 270,602
Segment results
Profit (loss) before interest and tax 29,629 5,041 1,321 (1,069) 52 34,974 184 – 35,158
Finance costs and other finance
expense ––––(516)(516)––(516)
------------------------------------------------------------------------------------------------------------------------------------------------------------------------------------------------------------------------------------------------------------------------------------------------------------
Profit (loss) before taxation 29,629 5,041 1,321 (1,069) (464) 34,458 184 – 34,642
Taxation ––––(12,172)(12,172)(159)–(12,331)
------------------------------------------------------------------------------------------------------------------------------------------------------------------------------------------------------------------------------------------------------------------------------------------------------------
Profit (loss) for the year 29,629 5,041 1,321 (1,069) (12,636) 22,286 25 – 22,311
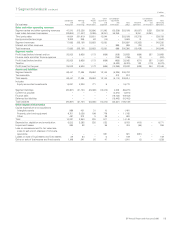
Assets and liabilities
Segment assets 99,310 80,964 27,398 14,184 (4,799) 217,057
Tax receivable ––––544544
------------------------------------------------------------------------------------------------------------------------------------------------------------------------------------------------------------------------------------------------------------------------------------------------------------
Total assets 99,310 80,964 27,398 14,184 (4,255) 217,601
------------------------------------------------------------------------------------------------------------------------------------------------------------------------------------------------------------------------------------------------------------------------------------------------------------
Includes
Equity-accounted investments 15,510 4,675 853 11 – 21,049
Segment liabilities (21,787) (33,399) (21,708) (14,555) 4,074 (87,375)
Current tax payable ––––(2,635)(2,635)
Finance debt ––––(24,010)(24,010)
Deferred tax liabilities ––––(18,116)(18,116)
------------------------------------------------------------------------------------------------------------------------------------------------------------------------------------------------------------------------------------------------------------------------------------------------------------
Total liabilities (21,787) (33,399) (21,708) (14,555) (40,687) (132,136)
Other segment information
Capital expenditure and acquisitions
Intangible assets 1,614 253 192 43 – 2,102
Property, plant and equipment 10,227 2,733 337 232 – 13,529
Other 1,277 158 159 6 – 1,600
------------------------------------------------------------------------------------------------------------------------------------------------------------------------------------------------------------------------------------------------------------------------------------------------------------
Total 13,118 3,144 688 281 – 17,231
------------------------------------------------------------------------------------------------------------------------------------------------------------------------------------------------------------------------------------------------------------------------------------------------------------
Depreciation, depletion and
amortization 6,533 2,244 192 159 – 9,128 – – 9,128
Impairment losses 137 155 100 69 – 461 – – 461
Impairment reversals 340 – – – – 340 – – 340
Loss on remeasurement to fair value
less costs to sell and on disposal of
Innovene operations – – – 184 – 184 (184) – –
Losses on sale of businesses and fixed
assets 195 228 – 5 – 428 – – 428
Gains on sale of businesses and fixed
assets 2,309 1,112 193 100 – 3,714 – – 3,714