BP 2006 Annual Report Download - page 19
Download and view the complete annual report
Please find page 19 of the 2006 BP annual report below. You can navigate through the pages in the report by either clicking on the pages listed below, or by using the keyword search tool below to find specific information within the annual report.-
 1
1 -
2
-
3
-
4
-
5
-
6
-
7
-
8
-
 9
9 -
 10
10 -
 11
11 -
 12
12 -
 13
13 -
 14
14 -
 15
15 -
 16
16 -
 17
17 -
 18
18 -
 19
19 -
 20
20 -
 21
21 -
 22
22 -
 23
23 -
 24
24 -
 25
25 -
 26
26 -
 27
27 -
 28
28 -
 29
29 -
30
-
31
-
32
-
33
-
34
-
35
-
36
-
37
-
38
-
39
-
40
-
41
-
42
-
43
-
44
-
45
-
46
-
47
-
48
-
49
-
50
-
51
-
52
-
53
-
54
-
55
-
56
-
57
-
58
-
59
-
60
-
61
-
62
-
63
-
64
-
65
-
66
-
67
-
68
-
69
-
70
-
71
-
72
-
73
-
74
-
75
-
76
-
77
-
78
-
79
-
80
-
81
-
82
-
83
-
84
-
85
-
86
-
87
-
88
-
89
-
90
-
91
-
92
-
93
-
94
-
95
-
96
-
97
-
98
-
99
-
100
-
101
-
102
-
103
-
104
-
105
-
106
-
107
-
108
-
109
-
110
-
111
-
112
-
113
-
114
-
115
-
116
-
117
-
118
-
119
-
120
-
121
-
122
-
123
-
124
-
125
-
126
-
127
-
128
-
129
-
130
-
131
-
132
-
133
-
134
-
135
-
136
-
137
-
138
-
139
-
140
-
141
-
142
-
143
-
144
-
145
-
146
-
147
-
148
-
149
-
150
-
151
-
152
-
153
-
154
-
155
-
156
-
157
-
158
-
159
-
160
-
161
-
162
-
163
-
164
-
165
-
166
-
167
-
168
-
169
-
170
-
171
-
172
-
173
-
174
-
175
-
176
-
177
-
178
-
179
-
180
-
181
-
182
-
183
-
184
-
185
-
186
-
187
-
188
-
189
-
190
-
191
-
192
-
193
-
194
-
195
-
196
-
197
-
198
-
199
-
200
-
201
-
202
-
203
-
204
-
205
-
206
-
207
-
208
-
209
-
210
-
211
-
212
-
213
-
214
-
215
-
216
-
217
-
218
-
219
-
220
-
221
-
222
-
223
-
224
-
225
-
226
-
227
-
228
 |
 |
technical and commercial evaluations, including appraisal drilling. Our
most significant discoveries in 2006 included the following:
– In Angola, we made further discoveries in the ‘ultra deepwater’
(greater than 1,500 metres) in Block 31 (BP 26.7% and operator) with
Urano, Titania and Terra wells, bringing the total number of discoveries
in Block 31 to 12.
– In the deepwater Gulf of Mexico, we made a discovery with the
Kaskida well.
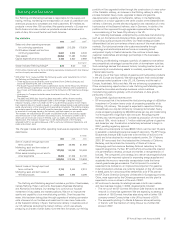
Reserves and production
BP manages its hydrocarbon resources in three major categories:
prospect inventory, non-proved resources and proved reserves. When a
discovery is made, volumes usually transfer from the prospect inventory
to the non-proved resource category. The resources move through
various non-proved resource sub-categories as their technical and
commercial maturity increases through appraisal activity.
Resources in a field will only be categorized as proved reserves when
all the criteria for attribution of proved status have been met, including
an internally imposed requirement for project sanction or for sanction
expected within six months and, for additional reserves in existing fields,
the requirement that the reserves be included in the business plan and
scheduled for development, typically within three years. Where, on
occasion, the group decides to book reserves where development is
scheduled to commence beyond three years, these reserves will be
booked only where they satisfy the SEC’s criteria for attribution of proved
status. Internal approval and final investment decision are what we refer
to as project sanction.
At the point of sanction, all booked reserves will be categorized as
proved undeveloped (PUD). Volumes will subsequently be recategorized
from PUD to proved developed (PD) as a consequence of development
activity. When part of a well’s reserves depends on a later phase of
activity, only that portion of reserves associated with existing, available
facilities and infrastructure moves to PD. The first PD bookings will occur
at the point of first oil or gas production. Major development projects
typically take one to four years from the time of initial booking to the
start of production. Changes to reserves bookings may be made due
to analysis of new or existing data concerning production, reservoir
performance, commercial factors, acquisition and divestment activity and
additional reservoir development activity.
BP has an internal process to control the quality of reserves bookings
that forms part of a holistic and integrated system of internal control. BP’s
process to manage reserves bookings has been centrally controlled for
more than 15 years and it currently has several key elements.
The first element is the accountabilities of certain officers of the
company to ensure that there are effective controls in the proved
reserves verification and approval process of the group’s reserves
estimates and the timely reporting of the related financial impacts of
proved reserves changes. These officers of the company are responsible
for carrying out verification of proved reserves estimates and are
independent of the operating business unit to ensure integrity and
accuracy of reporting.
The second element is the capital allocation processes whereby
delegated authority is exercised to commit to capital projects that are
consistent with the delivery of the group’s business plan. A formal review
process exists to ensure that both technical and commercial criteria are
met prior to the commitment of capital to projects.
The third element is Internal Audit, whose role includes systematically
examining the effectiveness of the group’s financial controls designed
to assure the reliability of reporting and safeguarding of assets and
examining the group’s compliance with laws, regulations and internal
standards.
The fourth element is a quarterly due diligence review, which is
separate and independent from the operating business units, of proved
reserves associated with properties where technical, operational or
commercial issues have arisen.
The fifth element is the established criteria whereby proved
reserves changes above certain thresholds require central authorization.
Furthermore, the volumes booked under these authorization levels are
reviewed on a periodic basis. The frequency of review is determined
according to field size and ensures that more than 80% of the BP
reserves base undergoes central review every two years and more than
90% is reviewed every four years.
For the executive directors and senior management, no specific portion
of compensation bonuses is directly related to oil and gas reserves
targets. Additions to proved reserves is one of several indicators by which
the performance of the Exploration and Production business segment
is assessed by the remuneration committee for the purposes of
determining compensation bonuses for the executive directors and senior
management. Other indicators include a number of financial and
operational measures.
BP’s variable pay programme for the other senior managers in the
Exploration and Production business segment is based on individual
performance contracts. Individual performance contracts are based on
agreed items from the business performance plan, one of which, if they
choose, could relate to oil and gas reserves.
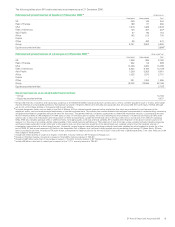
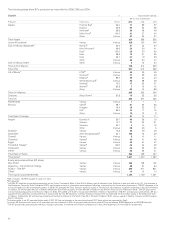
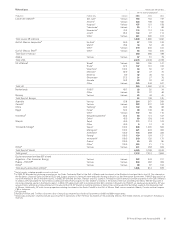
Details of our net proved reserves of crude oil, condensate, natural
gas liquids and natural gas at 31 December 2006, 2005 and 2004 and
reserves changes for each of the three years then ended are set out in
the Supplementary information on oil and natural gas section beginning on
page 196. We separately disclose our share of reserves held in equity-
accounted companies (jointly controlled entities and associates), although
we do not control these entities or the assets held by such entities.
All the group’s oil and gas reserves held in consolidated companies
have been estimated by the group’s petroleum engineers. Of the
equity-accounted volumes in 2006, 17% were based on estimates
prepared by group petroleum engineers and 83% were based on
estimates prepared by independent engineering consultants, although
all the group’s oil and gas reserves held in equity-accounted companies
are reviewed by the group’s petroleum engineers before making the
assessment of volumes to be booked by BP.
Our proved reserves are associated with both concessions (tax and
royalty arrangements) and production-sharing agreements (PSAs). In
a concession, the consortium of which we are a part is entitled to the
reserves that can be produced over the licence period, which may be the
life of the field. In a PSA, we are entitled to recover volumes that equate
to costs incurred to develop and produce the reserves and an agreed
share of the remaining volumes or the economic equivalent. As part
of our entitlement is driven by the monetary amount of costs to be
recovered, price fluctuations will have an impact on both production
volumes and reserves. Fifteen per cent of our proved reserves are
associated with PSAs. The main countries in which we operate under
PSAs are Algeria, Angola, Azerbaijan, Egypt, Indonesia and Vietnam.
At the end of 2006, BP adopted the SEC rules for estimating reserves
for all accounting and reporting purposes. Previously, BP applied the UK
accounting rules contained in the Statement of Recommended Practice
‘Accounting for Oil and Gas Exploration, Development, Production and
Decommissioning Activities’ (UK SORP). These changes are explained in
Financial statements – Note 3 on page 110. The company’s proved
reserves estimates for the year ended 31 December 2006 reflect
year-end prices and application of SEC interpretations of SEC regulations
relating to the use of technology (mainly seismic) to estimate reserves in
the reservoir away from wellbores and the reporting of fuel gas (i.e. gas
used for fuel in operations on the lease) within proved reserves.
Consequently, these reserves quantities differ from those that would
be reported under application of the UK SORP. The 2006 year-end
marker prices used were Brent $58.93/bbl (2005 $58.21/bbl and 2004
$40.24/bbl) and Henry Hub $5.52/mmBtu (2005 $9.52/mmBtu and
2004 $6.01/mmBtu). The other 2006 movements in proved reserves
are reflected in the tables showing movements in oil and gas reserves
by region in Financial statements – Supplementary information on oil
and natural gas on pages 196-197.
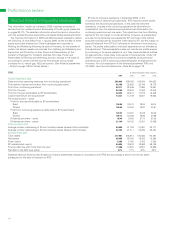
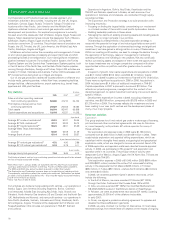
Total hydrocarbon proved reserves, on an oil equivalent basis and
excluding equity-accounted entities, comprised 13,163mmboe at
31 December 2006, a decrease of 6.1% compared with 31 December
2005. Natural gas represents about 55% of these reserves. This reduction
includes net sales of 227mmboe, largely comprising a number of assets
in Latin America, the UK and the US.
The proved reserves replacement ratio, excluding equity-accounted
entities, was 34% (2005 68% and 2004 78%). The proved reserves
replacement ratio (also known as the production replacement ratio) is the
extent to which production is replaced by proved reserves additions. This
BP Annual Report and Accounts 2006 17