BP 2006 Annual Report Download - page 100
Download and view the complete annual report
Please find page 100 of the 2006 BP annual report below. You can navigate through the pages in the report by either clicking on the pages listed below, or by using the keyword search tool below to find specific information within the annual report.-
 1
1 -
2
-
3
-
4
-
5
-
6
-
7
-
8
-
9
-
10
-
11
-
12
-
13
-
14
-
15
-
16
-
17
-
18
-
19
-
20
-
21
-
22
-
23
-
24
-
25
-
26
-
27
-
28
-
29
-
30
-
31
-
32
-
33
-
34
-
35
-
36
-
37
-
38
-
39
-
40
-
41
-
42
-
43
-
44
-
45
-
46
-
47
-
48
-
49
-
50
-
51
-
52
-
53
-
54
-
55
-
56
-
57
-
58
-
59
-
60
-
61
-
62
-
63
-
64
-
65
-
66
-
67
-
68
-
69
-
70
-
71
-
72
-
73
-
74
-
75
-
76
-
77
-
78
-
79
-
80
-
81
-
82
-
83
-
84
-
85
-
86
-
87
-
88
-
89
-
 90
90 -
 91
91 -
 92
92 -
 93
93 -
 94
94 -
 95
95 -
 96
96 -
 97
97 -
 98
98 -
 99
99 -
 100
100 -
 101
101 -
 102
102 -
 103
103 -
 104
104 -
 105
105 -
 106
106 -
 107
107 -
 108
108 -
 109
109 -
 110
110 -
111
-
112
-
113
-
114
-
115
-
116
-
117
-
118
-
119
-
120
-
121
-
122
-
123
-
124
-
125
-
126
-
127
-
128
-
129
-
130
-
131
-
132
-
133
-
134
-
135
-
136
-
137
-
138
-
139
-
140
-
141
-
142
-
143
-
144
-
145
-
146
-
147
-
148
-
149
-
150
-
151
-
152
-
153
-
154
-
155
-
156
-
157
-
158
-
159
-
160
-
161
-
162
-
163
-
164
-
165
-
166
-
167
-
168
-
169
-
170
-
171
-
172
-
173
-
174
-
175
-
176
-
177
-
178
-
179
-
180
-
181
-
182
-
183
-
184
-
185
-
186
-
187
-
188
-
189
-
190
-
191
-
192
-
193
-
194
-
195
-
196
-
197
-
198
-
199
-
200
-
201
-
202
-
203
-
204
-
205
-
206
-
207
-
208
-
209
-
210
-
211
-
212
-
213
-
214
-
215
-
216
-
217
-
218
-
219
-
220
-
221
-
222
-
223
-
224
-
225
-
226
-
227
-
228
 |
 |

98
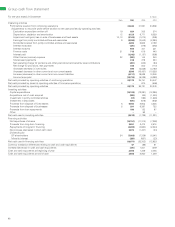
Group cash flow statement
For the year ended 31 December $ million
------------------------------------------------------------------------------------------------------------------------------------------------------------------------------------------------------------------------------------------------------------------------------------------------------------
Note 2006 2005 2004
------------------------------------------------------------------------------------------------------------------------------------------------------------------------------------------------------------------------------------------------------------------------------------------------------------
Operating activities
Profit before taxation from continuing operations 34,642 31,921 24,966
Adjustments to reconcile profit before taxation to net cash provided by operating activities
Exploration expenditure written off 19 624 305 274
Depreciation, depletion and amortization 12 9,128 8,771 8,529
Impairment and (gain) loss on sale of businesses and fixed assets 10, 13 (3,165) (1,070) (295)
Earnings from jointly controlled entities and associates 8(3,995) (3,543) (2,280)
Dividends received from jointly controlled entities and associates 4,495 2,833 2,199
Interest receivable (473) (479) (284)
Interest received 500 401 331
Finance costs 21 718 616 440
Interest paid (1,242) (1,127) (698)
Other finance (income) expense 22 (202) 145 340
Share-based payments 416 278 224
Net operating charge for pensions and other post-retirement benefits, less contributions (261) (435) (84)
Net charge for provisions, less payments 340 600 (110)
(Increase) decrease in inventories 995 (6,638) (3,182)
(Increase) decrease in other current and non-current assets 3,596 (16,427) (10,225)
Increase (decrease) in other current and non-current liabilities (4,211) 18,628 10,290
Income taxes paid (13,733) (9,028) (6,388)
------------------------------------------------------------------------------------------------------------------------------------------------------------------------------------------------------------------------------------------------------------------------------------------------------------
Net cash provided by operating activities of continuing operations 28,172 25,751 24,047
Net cash provided by (used in) operating activities of Innovene operations 5–970 (669)
------------------------------------------------------------------------------------------------------------------------------------------------------------------------------------------------------------------------------------------------------------------------------------------------------------
Net cash provided by operating activities 28,172 26,721 23,378
------------------------------------------------------------------------------------------------------------------------------------------------------------------------------------------------------------------------------------------------------------------------------------------------------------
Investing activities
Capital expenditures (15,125) (12,281) (12,286)
Acquisitions, net of cash acquired (229) (60) (1,503)
Investment in jointly controlled entities (37) (185) (1,648)
Investment in associates (570) (619) (942)
Proceeds from disposal of fixed assets 65,963 2,803 4,236
Proceeds from disposal of businesses 6291 8,397 725
Proceeds from loan repayments 189 123 87
Other –93 –
------------------------------------------------------------------------------------------------------------------------------------------------------------------------------------------------------------------------------------------------------------------------------------------------------------
Net cash used in investing activities (9,518) (1,729) (11,331)
------------------------------------------------------------------------------------------------------------------------------------------------------------------------------------------------------------------------------------------------------------------------------------------------------------
Financing activities
Net repurchase of shares (15,151) (11,315) (7,208)
Proceeds from long-term financing 3,831 2,475 2,675
Repayments of long-term financing (3,655) (4,820) (2,204)
Net increase (decrease) in short-term debt 3,873 (1,457) (24)
Dividends paid
BP shareholders 24 (7,686) (7,359) (6,041)
Minority interest (283) (827) (33)
------------------------------------------------------------------------------------------------------------------------------------------------------------------------------------------------------------------------------------------------------------------------------------------------------------
Net cash used in financing activities (19,071) (23,303) (12,835)
------------------------------------------------------------------------------------------------------------------------------------------------------------------------------------------------------------------------------------------------------------------------------------------------------------
Currency translation differences relating to cash and cash equivalents 47 (88) 91
------------------------------------------------------------------------------------------------------------------------------------------------------------------------------------------------------------------------------------------------------------------------------------------------------------
Increase (decrease) in cash and cash equivalents (370) 1,601 (697)
Cash and cash equivalents at beginning of year 2,960 1,359 2,056
------------------------------------------------------------------------------------------------------------------------------------------------------------------------------------------------------------------------------------------------------------------------------------------------------------
Cash and cash equivalents at end of year 2,590 2,960 1,359