BP 2006 Annual Report Download - page 139
Download and view the complete annual report
Please find page 139 of the 2006 BP annual report below. You can navigate through the pages in the report by either clicking on the pages listed below, or by using the keyword search tool below to find specific information within the annual report.-
 1
1 -
2
-
3
-
4
-
5
-
6
-
7
-
8
-
9
-
10
-
11
-
12
-
13
-
14
-
15
-
16
-
17
-
18
-
19
-
20
-
21
-
22
-
23
-
24
-
25
-
26
-
27
-
28
-
29
-
30
-
31
-
32
-
33
-
34
-
35
-
36
-
37
-
38
-
39
-
40
-
41
-
42
-
43
-
44
-
45
-
46
-
47
-
48
-
49
-
50
-
51
-
52
-
53
-
54
-
55
-
56
-
57
-
58
-
59
-
60
-
61
-
62
-
63
-
64
-
65
-
66
-
67
-
68
-
69
-
70
-
71
-
72
-
73
-
74
-
75
-
76
-
77
-
78
-
79
-
80
-
81
-
82
-
83
-
84
-
85
-
86
-
87
-
88
-
89
-
90
-
91
-
92
-
93
-
94
-
95
-
96
-
97
-
98
-
99
-
100
-
101
-
102
-
103
-
104
-
105
-
106
-
107
-
108
-
109
-
110
-
111
-
112
-
113
-
114
-
115
-
116
-
117
-
118
-
119
-
120
-
121
-
122
-
123
-
124
-
125
-
126
-
127
-
128
-
 129
129 -
 130
130 -
 131
131 -
 132
132 -
 133
133 -
 134
134 -
 135
135 -
 136
136 -
 137
137 -
 138
138 -
 139
139 -
 140
140 -
 141
141 -
 142
142 -
 143
143 -
 144
144 -
 145
145 -
 146
146 -
 147
147 -
 148
148 -
 149
149 -
150
-
151
-
152
-
153
-
154
-
155
-
156
-
157
-
158
-
159
-
160
-
161
-
162
-
163
-
164
-
165
-
166
-
167
-
168
-
169
-
170
-
171
-
172
-
173
-
174
-
175
-
176
-
177
-
178
-
179
-
180
-
181
-
182
-
183
-
184
-
185
-
186
-
187
-
188
-
189
-
190
-
191
-
192
-
193
-
194
-
195
-
196
-
197
-
198
-
199
-
200
-
201
-
202
-
203
-
204
-
205
-
206
-
207
-
208
-
209
-
210
-
211
-
212
-
213
-
214
-
215
-
216
-
217
-
218
-
219
-
220
-
221
-
222
-
223
-
224
-
225
-
226
-
227
-
228
 |
 |

BP Annual Report and Accounts 2006 137
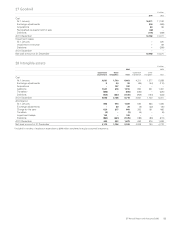
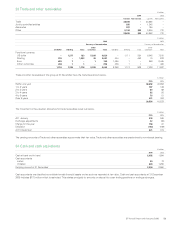
29 Investments in jointly controlled entities continued
Purchases from jointly controlled entities $ million
------------------------------------------------------------------------------------------------------------------------------------------------------------------------------------------------------------------------------------------------------------------------------------------------------------
2006 2005 2004
------------------------------------------------------------------------------------------------------------------------------------------------------------------------------------------------------------------------------------------------------------------------------------------------------------
Product Purchases
Amount
payable at
31 December Purchases
Amount
payable at
31 December Purchases
Amount
payable at
31 December
------------------------------------------------------------------------------------------------------------------------------------------------------------------------------------------------------------------------------------------------------------------------------------------------------------
Atlantic LNG 2/3 Company of Trinidad and Tobago Plant processing fee/
natural gas 254 – 190 – 120 –
Pan American Energy Crude oil 42661 81 481 43
Ruhr Oel Refinery operating costs 758 32 384 134 477 249
TNK-BP Crude oil and oil products 2,662 85 908 17 1,809 80
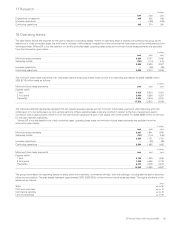
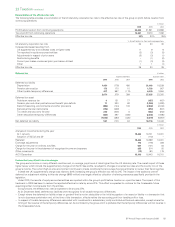
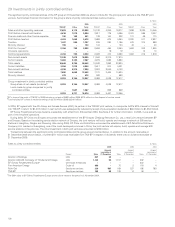
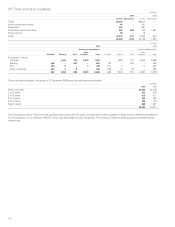
30 Investments in associates
The significant associates of the group are shown in Note 50. Summarized financial information for the group’s share of associates is set out below.
$ million
------------------------------------------------------------------------------------------------------------------------------------------------------------------------------------------------------------------------------------------------------------------------------------------------------------
2006 2005 2004
------------------------------------------------------------------------------------------------------------------------------------------------------------------------------------------------------------------------------------------------------------------------------------------------------------
Sales and other operating revenues 8,792 6,879 5,509
------------------------------------------------------------------------------------------------------------------------------------------------------------------------------------------------------------------------------------------------------------------------------------------------------------
Profit before interest and taxation 669 665 632
Finance costs and other finance expense 63 57 48
------------------------------------------------------------------------------------------------------------------------------------------------------------------------------------------------------------------------------------------------------------------------------------------------------------
Profit before taxation 606 608 584
Taxation 164 143 121
------------------------------------------------------------------------------------------------------------------------------------------------------------------------------------------------------------------------------------------------------------------------------------------------------------
Profit for the year 442 465 463
Innovene operations –(5) (1)
------------------------------------------------------------------------------------------------------------------------------------------------------------------------------------------------------------------------------------------------------------------------------------------------------------
Continuing operations 442 460 462
Non-current assets 6,573 5,514
Current assets 2,294 2,248
--------------------------------------------------------------------------------------------------------------------------------------------------------------------------------------------------------------------------------------------------------------------------------------
Total assets 8,867 7,762
--------------------------------------------------------------------------------------------------------------------------------------------------------------------------------------------------------------------------------------------------------------------------------------
Current liabilities 2,029 1,755
Non-current liabilities 2,600 2,037
--------------------------------------------------------------------------------------------------------------------------------------------------------------------------------------------------------------------------------------------------------------------------------------
Total liabilities 4,629 3,792
--------------------------------------------------------------------------------------------------------------------------------------------------------------------------------------------------------------------------------------------------------------------------------------
Net assets 4,238 3,970
Group investment in associates
Group share of net assets (as above)a4,238 3,970
Loans made by group companies to associates 1,737 2,247
--------------------------------------------------------------------------------------------------------------------------------------------------------------------------------------------------------------------------------------------------------------------------------------
5,975 6,217
aIncludes BP’s share of retained earnings of $480 million (2005 $696 million).
BP Solvay Polyethylene North America became a subsidiary with effect from 2 November 2004. See Note 4 for further information. In 2005, it was sold
as part of the Innovene operations.
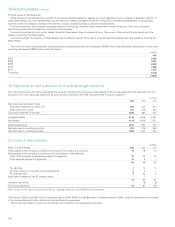
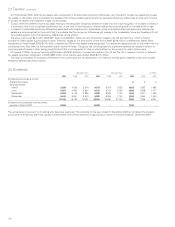
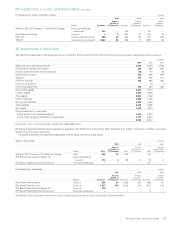
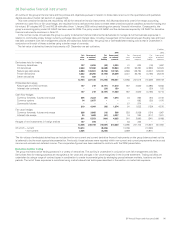
Transactions between the significant associates and the group are summarized below.
Sales to associates $ million
------------------------------------------------------------------------------------------------------------------------------------------------------------------------------------------------------------------------------------------------------------------------------------------------------------
2006 2005 2004
------------------------------------------------------------------------------------------------------------------------------------------------------------------------------------------------------------------------------------------------------------------------------------------------------------
Product Sales
Amount
receivable at
31 December Sales
Amount
receivable at
31 December Sales
Amount
receivable at
31 December
------------------------------------------------------------------------------------------------------------------------------------------------------------------------------------------------------------------------------------------------------------------------------------------------------------
Atlantic LNG Company of Trinidad and Tobago LNG 635 62 579 – 414 –
The Baku-Tbilisi-Ceyhan Pipeline Co Crude oil/employee
services 112 4 99 3 46 3
BP Solvay Polyethylene North AmericaaChemicals feedstocks ––––217–
Purchases from associates $ million
------------------------------------------------------------------------------------------------------------------------------------------------------------------------------------------------------------------------------------------------------------------------------------------------------------
2006 2005 2004
------------------------------------------------------------------------------------------------------------------------------------------------------------------------------------------------------------------------------------------------------------------------------------------------------------
Product Purchases
Amount
payable at
31 December Purchases
Amount
payable at
31 December Purchases
Amount
payable at
31 December
------------------------------------------------------------------------------------------------------------------------------------------------------------------------------------------------------------------------------------------------------------------------------------------------------------
Abu Dhabi Marine Areas Crude oil 866 91 1,355 164 866 91
Abu Dhabi Petroleum Co. Crude oil 1,547 145 2,260 214 1,547 145
The Baku-Tbilisi-Ceyhan Pipeline Co Crude oil 155 – ––––
BP Solvay Polyethylene North AmericaaChemicals feedstocks ––––9–
aThe 2004 BP Solvay Polyethylene North America sales and purchases shown above relate to the period to 2 November 2004.