BP 2006 Annual Report Download - page 158
Download and view the complete annual report
Please find page 158 of the 2006 BP annual report below. You can navigate through the pages in the report by either clicking on the pages listed below, or by using the keyword search tool below to find specific information within the annual report.-
 1
1 -
2
-
3
-
4
-
5
-
6
-
7
-
8
-
9
-
10
-
11
-
12
-
13
-
14
-
15
-
16
-
17
-
18
-
19
-
20
-
21
-
22
-
23
-
24
-
25
-
26
-
27
-
28
-
29
-
30
-
31
-
32
-
33
-
34
-
35
-
36
-
37
-
38
-
39
-
40
-
41
-
42
-
43
-
44
-
45
-
46
-
47
-
48
-
49
-
50
-
51
-
52
-
53
-
54
-
55
-
56
-
57
-
58
-
59
-
60
-
61
-
62
-
63
-
64
-
65
-
66
-
67
-
68
-
69
-
70
-
71
-
72
-
73
-
74
-
75
-
76
-
77
-
78
-
79
-
80
-
81
-
82
-
83
-
84
-
85
-
86
-
87
-
88
-
89
-
90
-
91
-
92
-
93
-
94
-
95
-
96
-
97
-
98
-
99
-
100
-
101
-
102
-
103
-
104
-
105
-
106
-
107
-
108
-
109
-
110
-
111
-
112
-
113
-
114
-
115
-
116
-
117
-
118
-
119
-
120
-
121
-
122
-
123
-
124
-
125
-
126
-
127
-
128
-
129
-
130
-
131
-
132
-
133
-
134
-
135
-
136
-
137
-
138
-
139
-
140
-
141
-
142
-
143
-
144
-
145
-
146
-
147
-
 148
148 -
 149
149 -
 150
150 -
 151
151 -
 152
152 -
 153
153 -
 154
154 -
 155
155 -
 156
156 -
 157
157 -
 158
158 -
 159
159 -
 160
160 -
 161
161 -
 162
162 -
 163
163 -
 164
164 -
 165
165 -
 166
166 -
 167
167 -
 168
168 -
169
-
170
-
171
-
172
-
173
-
174
-
175
-
176
-
177
-
178
-
179
-
180
-
181
-
182
-
183
-
184
-
185
-
186
-
187
-
188
-
189
-
190
-
191
-
192
-
193
-
194
-
195
-
196
-
197
-
198
-
199
-
200
-
201
-
202
-
203
-
204
-
205
-
206
-
207
-
208
-
209
-
210
-
211
-
212
-
213
-
214
-
215
-
216
-
217
-
218
-
219
-
220
-
221
-
222
-
223
-
224
-
225
-
226
-
227
-
228
 |
 |

156
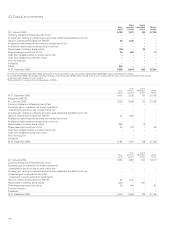
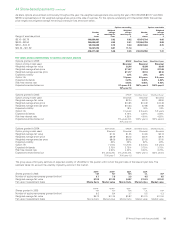
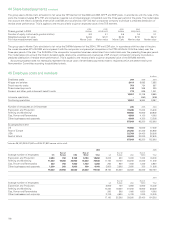
41 Pensions and other post-retirement benefits continued
$ million
------------------------------------------------------------------------------------------------------------------------------------------------------------------------------------------------------------------------------------------------------------------------------------------------------------
2005
------------------------------------------------------------------------------------------------------------------------------------------------------------------------------------------------------------------------------------------------------------------------------------------------------------
Analysis of the amount charged to profit before interest and taxation
UK
pension
plans
US
pension
plans
US
other post-
retirement
benefit plans Other plans Total
------------------------------------------------------------------------------------------------------------------------------------------------------------------------------------------------------------------------------------------------------------------------------------------------------------
Current service cost 379 216 50 140 785
Past service cost 5 (10) (5) 51 41
Settlement, curtailment and special termination benefits 37 – – 10 47
Payments to defined contribution plans – 158 – 14 172
------------------------------------------------------------------------------------------------------------------------------------------------------------------------------------------------------------------------------------------------------------------------------------------------------------
Total operating charge 421 364 45 215 1,045
Innovene operations (38) (24) (3) (21) (86)
------------------------------------------------------------------------------------------------------------------------------------------------------------------------------------------------------------------------------------------------------------------------------------------------------------
Continuing operationsa383 340 42 194 959
Analysis of the amount credited (charged) to other finance expense
------------------------------------------------------------------------------------------------------------------------------------------------------------------------------------------------------------------------------------------------------------------------------------------------------------
Expected return on plan assets 1,456 557 2 123 2,138
Interest on plan liabilities (1,003) (444) (207) (368) (2,022)
------------------------------------------------------------------------------------------------------------------------------------------------------------------------------------------------------------------------------------------------------------------------------------------------------------
Other finance income (expense) 453 113 (205) (245) 116
Innovene operations (10) (5) 2 10 (3)
------------------------------------------------------------------------------------------------------------------------------------------------------------------------------------------------------------------------------------------------------------------------------------------------------------
Continuing operations 443 108 (203) (235) 113
Analysis of the amount recognized in the statement of recognized income and expense
------------------------------------------------------------------------------------------------------------------------------------------------------------------------------------------------------------------------------------------------------------------------------------------------------------
Actual return less expected return on pension plan assets 3,111 96 – 157 3,364
Change in assumptions underlying the present value of the plan liabilities (1,884) (59) 236 (470) (2,177)
Experience gains and losses arising on the plan liabilities (14) (197) (17) 16 (212)
------------------------------------------------------------------------------------------------------------------------------------------------------------------------------------------------------------------------------------------------------------------------------------------------------------
Actuarial gain (loss) recognized in statement of recognized income and expense 1,213 (160) 219 (297) 975
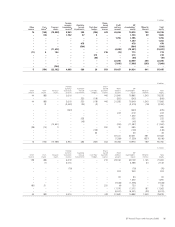
Movements in benefit obligation during the year
------------------------------------------------------------------------------------------------------------------------------------------------------------------------------------------------------------------------------------------------------------------------------------------------------------
Benefit obligation at 1 January 20,399 7,826 3,676 8,044 39,945
Exchange adjustments (2,194) – – (928) (3,122)
Current service cost 379 216 50 140 785
Past service cost 5 (10) (5) 51 41
Interest cost 1,003 444 207 368 2,022
Special termination benefits 37 – – 10 47
Contributions by plan participants 37 – – 5 42
Benefit payments (funded plans) (922) (570) (4) (116) (1,612)
Benefit payments (unfunded plans) (1) (30) (204) (314) (549)
Acquisitions –20 16 339
Disposals (578) (252) (39) (303) (1,172)
Actuarial (gain) loss on obligation 1,898 256 (219) 454 2,389
------------------------------------------------------------------------------------------------------------------------------------------------------------------------------------------------------------------------------------------------------------------------------------------------------------
Benefit obligation at 31 December 20,063 7,900 3,478 7,414 38,855
------------------------------------------------------------------------------------------------------------------------------------------------------------------------------------------------------------------------------------------------------------------------------------------------------------
Movements in fair value of plan assets during the year
------------------------------------------------------------------------------------------------------------------------------------------------------------------------------------------------------------------------------------------------------------------------------------------------------------
Fair value of plan assets at 1 January 22,307 7,183 30 2,192 31,712
Exchange adjustments (2,469) – – (195) (2,664)
Expected return on plan assetsb1,456 557 2 123 2,138
Contributions by plan participants 37 – – 5 42
Contributions by employers (funded plans) 340 279 – 140 759
Benefit payments (funded plans) (922) (570) (4) (116) (1,612)
Acquisitions –8 ––8
Disposals (578) (236) – (26) (840)
Actuarial gain on plan assetsb3,111 96 – 157 3,364
------------------------------------------------------------------------------------------------------------------------------------------------------------------------------------------------------------------------------------------------------------------------------------------------------------
Fair value of plan assets at 31 December 23,282 7,317 28 2,280 32,907
Surplus (deficit) at 31 December 3,219 (583) (3,450) (5,134) (5,948)
------------------------------------------------------------------------------------------------------------------------------------------------------------------------------------------------------------------------------------------------------------------------------------------------------------
Represented by
Asset recognized 3,240 – – 42 3,282
Liability recognized (21) (583) (3,450) (5,176) (9,230)
------------------------------------------------------------------------------------------------------------------------------------------------------------------------------------------------------------------------------------------------------------------------------------------------------------
3,219 (583) (3,450) (5,134) (5,948)
------------------------------------------------------------------------------------------------------------------------------------------------------------------------------------------------------------------------------------------------------------------------------------------------------------
The surplus (deficit) may be analysed between funded and unfunded plans as follows
Funded 3,240 (226) (32) (476) 2,506
Unfunded (21) (357) (3,418) (4,658) (8,454)
------------------------------------------------------------------------------------------------------------------------------------------------------------------------------------------------------------------------------------------------------------------------------------------------------------
3,219 (583) (3,450) (5,134) (5,948)
------------------------------------------------------------------------------------------------------------------------------------------------------------------------------------------------------------------------------------------------------------------------------------------------------------
The defined benefit obligation may be analysed between funded and unfunded plans as follows
Funded (20,042) (7,543) (60) (2,756) (30,401)
Unfunded (21) (357) (3,418) (4,658) (8,454)
------------------------------------------------------------------------------------------------------------------------------------------------------------------------------------------------------------------------------------------------------------------------------------------------------------
(20,063) (7,900) (3,478) (7,414) (38,855)
aIncluded within production and manufacturing expenses and distribution and administration expenses.
bThe actual return on plan assets is made up of the sum of the expected return on plan assets and the actuarial gain on plan assets as disclosed above.