BP 2006 Annual Report Download - page 52
Download and view the complete annual report
Please find page 52 of the 2006 BP annual report below. You can navigate through the pages in the report by either clicking on the pages listed below, or by using the keyword search tool below to find specific information within the annual report.-
 1
1 -
2
-
3
-
4
-
5
-
6
-
7
-
8
-
9
-
10
-
11
-
12
-
13
-
14
-
15
-
16
-
17
-
18
-
19
-
20
-
21
-
22
-
23
-
24
-
25
-
26
-
27
-
28
-
29
-
30
-
31
-
32
-
33
-
34
-
35
-
36
-
37
-
38
-
39
-
40
-
41
-
 42
42 -
 43
43 -
 44
44 -
 45
45 -
 46
46 -
 47
47 -
 48
48 -
 49
49 -
 50
50 -
 51
51 -
 52
52 -
 53
53 -
 54
54 -
 55
55 -
 56
56 -
 57
57 -
 58
58 -
 59
59 -
 60
60 -
 61
61 -
 62
62 -
63
-
64
-
65
-
66
-
67
-
68
-
69
-
70
-
71
-
72
-
73
-
74
-
75
-
76
-
77
-
78
-
79
-
80
-
81
-
82
-
83
-
84
-
85
-
86
-
87
-
88
-
89
-
90
-
91
-
92
-
93
-
94
-
95
-
96
-
97
-
98
-
99
-
100
-
101
-
102
-
103
-
104
-
105
-
106
-
107
-
108
-
109
-
110
-
111
-
112
-
113
-
114
-
115
-
116
-
117
-
118
-
119
-
120
-
121
-
122
-
123
-
124
-
125
-
126
-
127
-
128
-
129
-
130
-
131
-
132
-
133
-
134
-
135
-
136
-
137
-
138
-
139
-
140
-
141
-
142
-
143
-
144
-
145
-
146
-
147
-
148
-
149
-
150
-
151
-
152
-
153
-
154
-
155
-
156
-
157
-
158
-
159
-
160
-
161
-
162
-
163
-
164
-
165
-
166
-
167
-
168
-
169
-
170
-
171
-
172
-
173
-
174
-
175
-
176
-
177
-
178
-
179
-
180
-
181
-
182
-
183
-
184
-
185
-
186
-
187
-
188
-
189
-
190
-
191
-
192
-
193
-
194
-
195
-
196
-
197
-
198
-
199
-
200
-
201
-
202
-
203
-
204
-
205
-
206
-
207
-
208
-
209
-
210
-
211
-
212
-
213
-
214
-
215
-
216
-
217
-
218
-
219
-
220
-
221
-
222
-
223
-
224
-
225
-
226
-
227
-
228
 |
 |

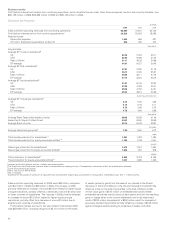
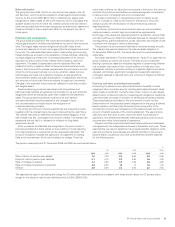
Business results
Profit before interest and taxation from continuing operations, which is before finance costs, other finance expense, taxation and minority interests,was
$35,158 million in 2006, $32,682 million in 2005 and $25,746 million in 2004.
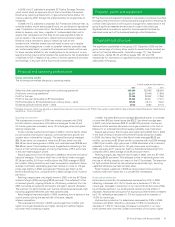
Exploration and Production
$million
------------------------------------------------------------------------------------------------------------------------------------------------------------------------------------------------------------------------------------------------------------------------------------------------------------
2006 2005 2004
------------------------------------------------------------------------------------------------------------------------------------------------------------------------------------------------------------------------------------------------------------------------------------------------------------
Sales and other operating revenues from continuing operations 52,600 47,210 34,700
Profit before interest and tax from continuing operationsa29,629 25,502 18,085
Results include
Exploration expense 1,045 684 637
Of which: Exploration expenditure written off 624 305 274
$ per barrel
------------------------------------------------------------------------------------------------------------------------------------------------------------------------------------------------------------------------------------------------------------------------------------------------------------
Key statistics
Average BP crude oil realizationsb
UK 62.45 51.22 36.11
USA 62.03 50.98 37.40
Rest of World 61.11 48.32 34.99
BP average 61.91 50.27 36.45
Average BP NGL realizationsb
UK 47.21 37.95 31.79
USA 36.13 31.94 25.67
Rest of World 36.03 35.11 27.76
BP average 37.17 33.23 26.75
Average BP liquids realizationsbc
UK 61.67 50.45 35.87
USA 57.25 47.83 35.41
Rest of World 59.54 47.56 34.51
BP average 59.23 48.51 35.39
$ per thousand cubic feet
------------------------------------------------------------------------------------------------------------------------------------------------------------------------------------------------------------------------------------------------------------------------------------------------------------
Average BP natural gas realizationsb
UK 6.33 5.53 4.32
USA 5.74 6.78 5.11
Rest of World 3.70 3.46 2.74
BP average 4.72 4.90 3.86
$ per barrel
------------------------------------------------------------------------------------------------------------------------------------------------------------------------------------------------------------------------------------------------------------------------------------------------------------
Average West Texas Intermediate oil price 66.02 56.58 41.49
Alaska North Slope US West Coast 63.57 53.55 38.96
Average Brent oil price 65.14 54.48 38.27
$/mmBtu
------------------------------------------------------------------------------------------------------------------------------------------------------------------------------------------------------------------------------------------------------------------------------------------------------------
Average Henry Hub gas priced7.24 8.65 6.13
mb/d
------------------------------------------------------------------------------------------------------------------------------------------------------------------------------------------------------------------------------------------------------------------------------------------------------------
Total liquids production for subsidiariesce 1,351 1,423 1,480
Total liquids production for equity-accounted entitiesce 1,124 1,139 1,051
mmcf/d
------------------------------------------------------------------------------------------------------------------------------------------------------------------------------------------------------------------------------------------------------------------------------------------------------------
Natural gas production for subsidiariese7,412 7,512 7,624
Natural gas production for equity-accounted entitiese1,005 912 879
mboe/d
------------------------------------------------------------------------------------------------------------------------------------------------------------------------------------------------------------------------------------------------------------------------------------------------------------
Total production for subsidiariesef 2,629 2,718 2,795
Total production for equity-accounted entitiesef 1,297 1,296 1,202
aIncludes profit after interest and tax of equity-accounted entities.
bThe Exploration and Production business does not undertake any hedging activity. Consequently, realizations reflect the market price achieved.
cCrude oil and natural gas liquids.
dHenry Hub First of Month Index.
eNet of royalties.
fExpressed in thousands of barrels of oil equivalent per day (mboe/d). Natural gas is converted to oil equivalent at 5.8 billion cubic feet = 1 million barrels.
Sales and other operating revenues for 2006 were $53 billion, compared
with $47 billion in 2005 and $35 billion in 2004. The increase in 2006
primarily reflected an increase of around $6 billion related to higher liquids
and gas realizations, partially offset by a decrease of around $1 billion due
to lower volumes of subsidiaries. The increase in 2005 primarily reflected
an increase of around $13 billion related to higher liquids and gas
realizations, partially offset by a decrease of around $1 billion due to
slightly lower volumes of subsidiaries.
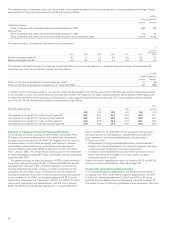
Profit before interest and tax for the year ended 31 December 2006
was $29,629 million, including net gains of $2,114 million on the sales
of assets (primarily gains from the sales of our interest in the Shenzi
discovery in the Gulf of Mexico in the US and interests in the North Sea
offset by a loss on the sale of properties in the Gulf of Mexico shelf),
net fair value gains of $515 million on embedded derivatives (these
embedded derivatives are fair valued at each period end with the resulting
gains or losses taken to the income statement) and a net impairment
credit of $203 million (comprised of a $340 million credit for reversals of
previously booked impairments partially offset by a charge of $109 million
against intangible assets relating to properties in Alaska, and other
50