BP 2006 Annual Report Download - page 213
Download and view the complete annual report
Please find page 213 of the 2006 BP annual report below. You can navigate through the pages in the report by either clicking on the pages listed below, or by using the keyword search tool below to find specific information within the annual report.-
 1
1 -
2
-
3
-
4
-
5
-
6
-
7
-
8
-
9
-
10
-
11
-
12
-
13
-
14
-
15
-
16
-
17
-
18
-
19
-
20
-
21
-
22
-
23
-
24
-
25
-
26
-
27
-
28
-
29
-
30
-
31
-
32
-
33
-
34
-
35
-
36
-
37
-
38
-
39
-
40
-
41
-
42
-
43
-
44
-
45
-
46
-
47
-
48
-
49
-
50
-
51
-
52
-
53
-
54
-
55
-
56
-
57
-
58
-
59
-
60
-
61
-
62
-
63
-
64
-
65
-
66
-
67
-
68
-
69
-
70
-
71
-
72
-
73
-
74
-
75
-
76
-
77
-
78
-
79
-
80
-
81
-
82
-
83
-
84
-
85
-
86
-
87
-
88
-
89
-
90
-
91
-
92
-
93
-
94
-
95
-
96
-
97
-
98
-
99
-
100
-
101
-
102
-
103
-
104
-
105
-
106
-
107
-
108
-
109
-
110
-
111
-
112
-
113
-
114
-
115
-
116
-
117
-
118
-
119
-
120
-
121
-
122
-
123
-
124
-
125
-
126
-
127
-
128
-
129
-
130
-
131
-
132
-
133
-
134
-
135
-
136
-
137
-
138
-
139
-
140
-
141
-
142
-
143
-
144
-
145
-
146
-
147
-
148
-
149
-
150
-
151
-
152
-
153
-
154
-
155
-
156
-
157
-
158
-
159
-
160
-
161
-
162
-
163
-
164
-
165
-
166
-
167
-
168
-
169
-
170
-
171
-
172
-
173
-
174
-
175
-
176
-
177
-
178
-
179
-
180
-
181
-
182
-
183
-
184
-
185
-
186
-
187
-
188
-
189
-
190
-
191
-
192
-
193
-
194
-
195
-
196
-
197
-
198
-
199
-
200
-
201
-
202
-
 203
203 -
 204
204 -
 205
205 -
 206
206 -
 207
207 -
 208
208 -
 209
209 -
 210
210 -
 211
211 -
 212
212 -
 213
213 -
 214
214 -
 215
215 -
 216
216 -
 217
217 -
 218
218 -
 219
219 -
 220
220 -
 221
221 -
 222
222 -
 223
223 -
224
-
225
-
226
-
227
-
228
 |
 |

BP Annual Report and Accounts 2006 211
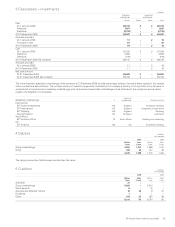
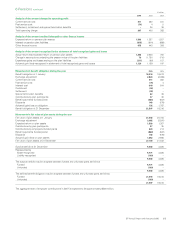
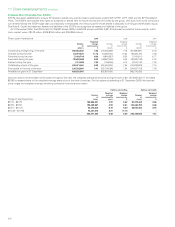
3 Fixed assets – investments
$ million
------------------------------------------------------------------------------------------------------------------------------------------------------------------------------------------------------------------------------------------------------------------------------------------------------------
Subsidiary
undertakings
Associated
undertakings
------------------------------------------------------------------
Shares Shares Loans Total
------------------------------------------------------------------------------------------------------------------------------------------------------------------------------------------------------------------------------------------------------------------------------------------------------------
Cost
At 1 January 2006 89,775 2 2 89,779
Additions 1,397 – – 1,397
Deletions (2,135) – – (2,135)
------------------------------------------------------------------------------------------------------------------------------------------------------------------------------------------------------------------------------------------------------------------------------------------------------------
At 31 December 2006 89,037 2 2 89,041
Amounts provided
At 1 January 2006 17 – 2 19
Provided in Year 57 – – 57
------------------------------------------------------------------------------------------------------------------------------------------------------------------------------------------------------------------------------------------------------------------------------------------------------------
At 31 December 2006 74 – 2 76
Cost
At 1 January 2005 87,345 2 2 87,349
Additions 2,949 – – 2,949
Deletions (519) – – (519)
------------------------------------------------------------------------------------------------------------------------------------------------------------------------------------------------------------------------------------------------------------------------------------------------------------
At 31 December 2005 (As restated) 89,775 2 2 89,779
Amounts provided
At 1 January 2005 17 – 2 19
------------------------------------------------------------------------------------------------------------------------------------------------------------------------------------------------------------------------------------------------------------------------------------------------------------
At 31 December 2005 17 – 2 19
Net book amount
At 31 December 2006 88,963 2 – 88,965
At 31 December 2005 (As restated) 89,758 2 – 89,760
The more important subsidiary undertakings of the company at 31 December 2006 and the percentage holding of ordinary share capital (to the nearest
whole number) are set out below. The principal country of operation is generally indicated by the company’s country of incorporation or by its name. A
complete list of investments in subsidiary undertakings, joint ventures and associated undertakings will be attached to the company’s annual return
made to the Registrar of Companies.
------------------------------------------------------------------------------------------------------------------------------------------------------------------------------------------------------------------------------------------------------------------------------------------------------------
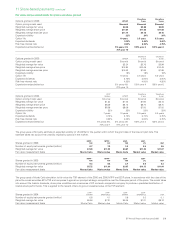
Subsidiary undertakings %
Country of
incorporation Principal activities
------------------------------------------------------------------------------------------------------------------------------------------------------------------------------------------------------------------------------------------------------------------------------------------------------------
International
BP Global Investments 100 England Investment holding
BP International 100 England Integrated oil operations
BP Shipping 100 England Shipping
Burmah Castrol 100 Scotland Lubricants
South Africa
BP Southern Africa 75 South Africa Refining and marketing
US
BP America 100 US Investment holding
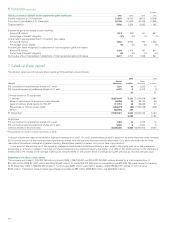
4 Debtors $ million
(As restated)
------------------------------------------------------------------------------------------------------------------------------------------------------------------------------------------------------------------------------------------------------------------------------------------------------------
2006 2005
------------------------------------------------------------------------------------------------------------------------------------------------------------------------------------------------------------------------------------------------------------------------------------------------------------
Within
1 year
After
1 year
Within
1 year
After
1 year
------------------------------------------------------------------------------------------------------------------------------------------------------------------------------------------------------------------------------------------------------------------------------------------------------------
Group undertakings 2,890 1,157 1,088 1,415
Other 184 39 127 38
------------------------------------------------------------------------------------------------------------------------------------------------------------------------------------------------------------------------------------------------------------------------------------------------------------
3,074 1,196 1,215 1,453
The carrying amounts of debtors approximate their fair value.
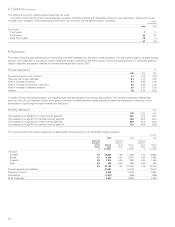
5 Creditors $ million
(As restated)
------------------------------------------------------------------------------------------------------------------------------------------------------------------------------------------------------------------------------------------------------------------------------------------------------------
2006 2005
------------------------------------------------------------------------------------------------------------------------------------------------------------------------------------------------------------------------------------------------------------------------------------------------------------
Within
1 year
After
1 year
Within
1 year
After
1 year
------------------------------------------------------------------------------------------------------------------------------------------------------------------------------------------------------------------------------------------------------------------------------------------------------------
Overdraft 21 – ––
Group undertakings 5,025 – 6,513 –
Social security 5–15 –
Accruals and deferred income 10 30 827
Dividends 1–1–
Other 154 27 187 38
------------------------------------------------------------------------------------------------------------------------------------------------------------------------------------------------------------------------------------------------------------------------------------------------------------
5,216 57 6,724 65