BP 2006 Annual Report Download - page 175
Download and view the complete annual report
Please find page 175 of the 2006 BP annual report below. You can navigate through the pages in the report by either clicking on the pages listed below, or by using the keyword search tool below to find specific information within the annual report.-
 1
1 -
2
-
3
-
4
-
5
-
6
-
7
-
8
-
9
-
10
-
11
-
12
-
13
-
14
-
15
-
16
-
17
-
18
-
19
-
20
-
21
-
22
-
23
-
24
-
25
-
26
-
27
-
28
-
29
-
30
-
31
-
32
-
33
-
34
-
35
-
36
-
37
-
38
-
39
-
40
-
41
-
42
-
43
-
44
-
45
-
46
-
47
-
48
-
49
-
50
-
51
-
52
-
53
-
54
-
55
-
56
-
57
-
58
-
59
-
60
-
61
-
62
-
63
-
64
-
65
-
66
-
67
-
68
-
69
-
70
-
71
-
72
-
73
-
74
-
75
-
76
-
77
-
78
-
79
-
80
-
81
-
82
-
83
-
84
-
85
-
86
-
87
-
88
-
89
-
90
-
91
-
92
-
93
-
94
-
95
-
96
-
97
-
98
-
99
-
100
-
101
-
102
-
103
-
104
-
105
-
106
-
107
-
108
-
109
-
110
-
111
-
112
-
113
-
114
-
115
-
116
-
117
-
118
-
119
-
120
-
121
-
122
-
123
-
124
-
125
-
126
-
127
-
128
-
129
-
130
-
131
-
132
-
133
-
134
-
135
-
136
-
137
-
138
-
139
-
140
-
141
-
142
-
143
-
144
-
145
-
146
-
147
-
148
-
149
-
150
-
151
-
152
-
153
-
154
-
155
-
156
-
157
-
158
-
159
-
160
-
161
-
162
-
163
-
164
-
 165
165 -
 166
166 -
 167
167 -
 168
168 -
 169
169 -
 170
170 -
 171
171 -
 172
172 -
 173
173 -
 174
174 -
 175
175 -
 176
176 -
 177
177 -
 178
178 -
 179
179 -
 180
180 -
 181
181 -
 182
182 -
 183
183 -
 184
184 -
 185
185 -
186
-
187
-
188
-
189
-
190
-
191
-
192
-
193
-
194
-
195
-
196
-
197
-
198
-
199
-
200
-
201
-
202
-
203
-
204
-
205
-
206
-
207
-
208
-
209
-
210
-
211
-
212
-
213
-
214
-
215
-
216
-
217
-
218
-
219
-
220
-
221
-
222
-
223
-
224
-
225
-
226
-
227
-
228
 |
 |

BP Annual Report and Accounts 2006 173
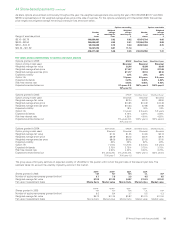
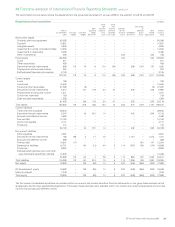
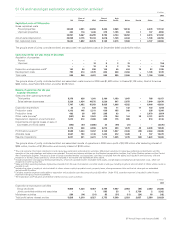
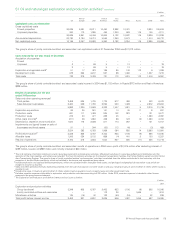
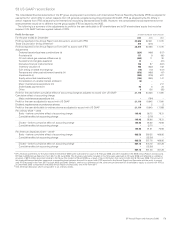
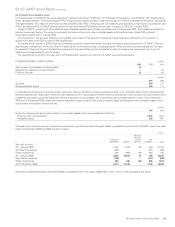
51 Oil and natural gas exploration and production activitiesa
$ million
------------------------------------------------------------------------------------------------------------------------------------------------------------------------------------------------------------------------------------------------------------------------------------------------------------
2006
------------------------------------------------------------------------------------------------------------------------------------------------------------------------------------------------------------------------------------------------------------------------------------------------------------
UK
Rest of
Europe USA
Rest of
Americas
Asia
Pacific Africa Russia Other Total
------------------------------------------------------------------------------------------------------------------------------------------------------------------------------------------------------------------------------------------------------------------------------------------------------------
Capitalized costs at 31 December
Gross capitalized costs
Proved properties 32,528 4,951 44,856 9,404 3,569 15,516 – 6,278 117,102
Unproved properties 423 116 1,443 379 1,155 936 1 137 4,590
------------------------------------------------------------------------------------------------------------------------------------------------------------------------------------------------------------------------------------------------------------------------------------------------------------
32,951 5,067 46,299 9,783 4,724 16,452 1 6,415 121,692
Accumulated depreciation 22,908 3,175 19,724 4,618 1,709 6,944 – 1,708 60,786
------------------------------------------------------------------------------------------------------------------------------------------------------------------------------------------------------------------------------------------------------------------------------------------------------------
Net capitalized costs 10,043 1,892 26,575 5,165 3,015 9,508 1 4,707 60,906
The group’s share of jointly controlled entities’ and associates’ net capitalized costs at 31 December 2006 was $10,870 million.
------------------------------------------------------------------------------------------------------------------------------------------------------------------------------------------------------------------------------------------------------------------------------------------------------------
Costs incurred for the year ended 31 December
Acquisition of properties
Proved –––––––––
Unproved – – 74 8 2 70 – – 154
------------------------------------------------------------------------------------------------------------------------------------------------------------------------------------------------------------------------------------------------------------------------------------------------------------
– – 74 8 2 70 – – 154
Exploration and appraisal costsb132 26 838 135 45 434 73 82 1,765
Development costs 794 214 3,579 820 238 2,356 – 1,108 9,109
------------------------------------------------------------------------------------------------------------------------------------------------------------------------------------------------------------------------------------------------------------------------------------------------------------
Total costs 926 240 4,491 963 285 2,860 73 1,190 11,028
The group’s share of jointly controlled entities’ and associates’ costs incurred in 2006 was $1,688 million: in Russia $1,109 milion, Rest of Americas
$424 million, Asia Pacific $16 million and other $139 million.
------------------------------------------------------------------------------------------------------------------------------------------------------------------------------------------------------------------------------------------------------------------------------------------------------------
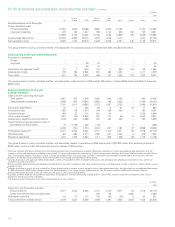
Results of operations for the year
ended 31 December
Sales and other operating revenuesc
Third parties 5,378 628 1,381 2,196 1,159 1,647 – 768 13,157
Sales between businesses 2,329 1,024 14,572 3,229 807 2,875 – 7,640 32,476
------------------------------------------------------------------------------------------------------------------------------------------------------------------------------------------------------------------------------------------------------------------------------------------------------------
7,707 1,652 15,953 5,425 1,966 4,522 – 8,408 45,633
------------------------------------------------------------------------------------------------------------------------------------------------------------------------------------------------------------------------------------------------------------------------------------------------------------
Exploration expenditure 20 (1) 634 132 11 132 17 100 1,045
Production costs 1,312 145 2,311 638 155 509 – 238 5,308
Production taxes 492 38 887 295 63 – – 2,079 3,854
Other costs (income)d(867) 90 2,561 478 154 104 32 3,121 5,673
Depreciation, depletion and amortization 1,612 213 2,083 685 175 865 – 510 6,143
Impairments and (gains) losses on sale of
businesses and fixed assets (450) (57) (1,880) 42 (99) (31) – – (2,475)
------------------------------------------------------------------------------------------------------------------------------------------------------------------------------------------------------------------------------------------------------------------------------------------------------------
2,119 428 6,596 2,270 459 1,579 49 6,048 19,548
------------------------------------------------------------------------------------------------------------------------------------------------------------------------------------------------------------------------------------------------------------------------------------------------------------
Profit before taxatione,f 5,588 1,224 9,357 3,155 1,507 2,943 (49) 2,360 26,085
Allocable taxes 2,567 793 3,136 1,443 472 1,328 3 737 10,479
------------------------------------------------------------------------------------------------------------------------------------------------------------------------------------------------------------------------------------------------------------------------------------------------------------
Results of operations 3,021 431 6,221 1,712 1,035 1,615 (52) 1,623 15,606
The group’s share of jointly controlled entities’ and associates’ results of operations in 2006 was a profit of $3,302 million after deducting interestof
$324 million, taxation of $1,804 million and minority interest of $193 million.
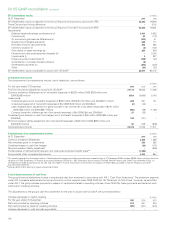
aThis note contains information relating to oil and natural gas exploration and production activities. Mid-stream activities of natural gas gathering and distribution and the
operation of the main pipelines and tankers are excluded. The main mid-stream activities are the Alaskan transportation facilities, the Forties Pipeline system and the Central
Area Transmission System. The group’s share of jointly controlled entities’ and associates’ activities is excluded from the tables and included in the footnotes, with the
exception of the Abu Dhabi operations, which are included in the income and expenditure items above.
bIncludes exploration and appraisal drilling expenditures, which are capitalized within intangible fixed assets, and geological and geophysical exploration costs, which are
charged to income as incurred.
cSales and other operating revenues represents proceeds from the sale of production and other crude oil and gas, including royalty oil sold on behalf of others where royalty is
payable in cash.
dIncludes the value of royalty oil sold on behalf of others where royalty is payable in cash, property taxes, other government take and the fair value gain on embedded
derivatives $515 million.
eExcludes accretion expense attributable to exploration and production activities amounting to $153 million. Under IFRS, accretion expense is included in other finance
expense in the group income statement.
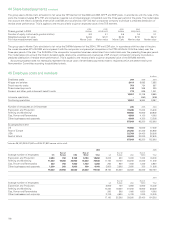
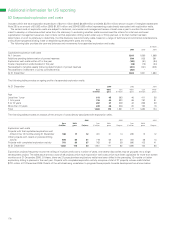
fThe Exploration and Production profit before interest and tax is set out below.
$ million
------------------------------------------------------------------------------------------------------------------------------------------------------------------------------------------------------------------------------------------------------------------------------------------------------------
2006
------------------------------------------------------------------------------------------------------------------------------------------------------------------------------------------------------------------------------------------------------------------------------------------------------------
Exploration and production activities
Group (as above) 5,588 1,224 9,357 3,155 1,507 2,943 (49) 2,360 26,085
Jointly controlled entities and associates – – 1 535 33 1 2,730 2 3,302
Mid-stream activities 250 (14) (31) 85 (31) (11) (24) 18 242
------------------------------------------------------------------------------------------------------------------------------------------------------------------------------------------------------------------------------------------------------------------------------------------------------------
Total profit before interest and tax 5,838 1,210 9,327 3,775 1,509 2,933 2,657 2,380 29,629