BP 2006 Annual Report Download - page 199
Download and view the complete annual report
Please find page 199 of the 2006 BP annual report below. You can navigate through the pages in the report by either clicking on the pages listed below, or by using the keyword search tool below to find specific information within the annual report.-
 1
1 -
2
-
3
-
4
-
5
-
6
-
7
-
8
-
9
-
10
-
11
-
12
-
13
-
14
-
15
-
16
-
17
-
18
-
19
-
20
-
21
-
22
-
23
-
24
-
25
-
26
-
27
-
28
-
29
-
30
-
31
-
32
-
33
-
34
-
35
-
36
-
37
-
38
-
39
-
40
-
41
-
42
-
43
-
44
-
45
-
46
-
47
-
48
-
49
-
50
-
51
-
52
-
53
-
54
-
55
-
56
-
57
-
58
-
59
-
60
-
61
-
62
-
63
-
64
-
65
-
66
-
67
-
68
-
69
-
70
-
71
-
72
-
73
-
74
-
75
-
76
-
77
-
78
-
79
-
80
-
81
-
82
-
83
-
84
-
85
-
86
-
87
-
88
-
89
-
90
-
91
-
92
-
93
-
94
-
95
-
96
-
97
-
98
-
99
-
100
-
101
-
102
-
103
-
104
-
105
-
106
-
107
-
108
-
109
-
110
-
111
-
112
-
113
-
114
-
115
-
116
-
117
-
118
-
119
-
120
-
121
-
122
-
123
-
124
-
125
-
126
-
127
-
128
-
129
-
130
-
131
-
132
-
133
-
134
-
135
-
136
-
137
-
138
-
139
-
140
-
141
-
142
-
143
-
144
-
145
-
146
-
147
-
148
-
149
-
150
-
151
-
152
-
153
-
154
-
155
-
156
-
157
-
158
-
159
-
160
-
161
-
162
-
163
-
164
-
165
-
166
-
167
-
168
-
169
-
170
-
171
-
172
-
173
-
174
-
175
-
176
-
177
-
178
-
179
-
180
-
181
-
182
-
183
-
184
-
185
-
186
-
187
-
188
-
 189
189 -
 190
190 -
 191
191 -
 192
192 -
 193
193 -
 194
194 -
 195
195 -
 196
196 -
 197
197 -
 198
198 -
 199
199 -
 200
200 -
 201
201 -
 202
202 -
 203
203 -
 204
204 -
 205
205 -
 206
206 -
 207
207 -
 208
208 -
 209
209 -
210
-
211
-
212
-
213
-
214
-
215
-
216
-
217
-
218
-
219
-
220
-
221
-
222
-
223
-
224
-
225
-
226
-
227
-
228
 |
 |

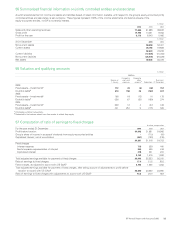
BP Annual Report and Accounts 2006 197
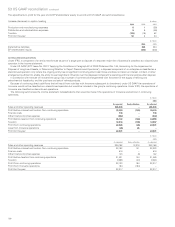
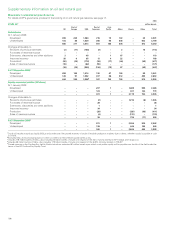
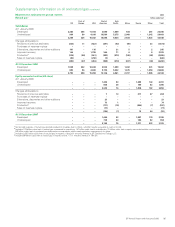
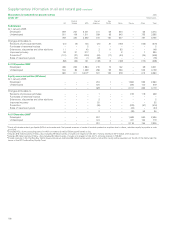
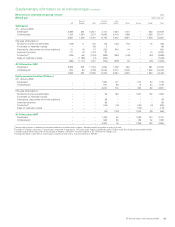
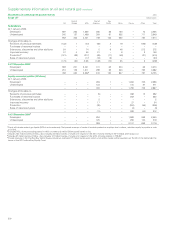
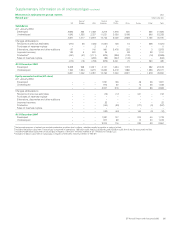
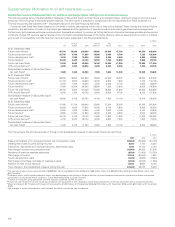
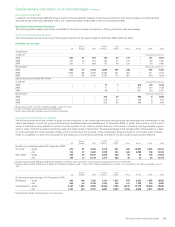
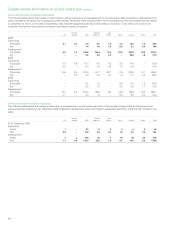
Supplementary information on oil and natural gas continued
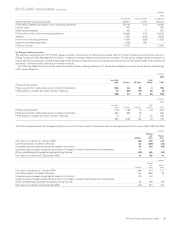
Movements in estimated net proved reserves 2006
------------------------------------------------------------------------------------------------------------------------------------------------------------------------------------------------------------------------------------------------------------------------------------------------------------
Natural gasabillion cubic feet
------------------------------------------------------------------------------------------------------------------------------------------------------------------------------------------------------------------------------------------------------------------------------------------------------------
UK
Rest of
Europe USA
Rest of
Americas
Asia
Pacific Africa Russia Other Total
------------------------------------------------------------------------------------------------------------------------------------------------------------------------------------------------------------------------------------------------------------------------------------------------------------
Subsidiaries
At 1 January 2006
Developed 2,382 245 11,184 3,560 1,459 934 – 281 20,045
Undeveloped 904 80 4,198 10,504 5,375 2,000 – 1,342 24,403
------------------------------------------------------------------------------------------------------------------------------------------------------------------------------------------------------------------------------------------------------------------------------------------------------------
3,286 325 15,382 14,064 6,834 2,934 – 1,623 44,448
Changes attributable to
Revisions of previous estimates (343) 11 (922) (291) (92) (69) – 33 (1,673)
Purchases of reserves-in-place –––––––––
Extensions, discoveries and other additions 101 – 116 – 21 5 – 2 245
Improved recovery 144 – 1,755 344 71 6 – 9 2,329
Productionb(370) (38) (941) (982) (273) (169) – (82) (2,855)
Sales of reserves-in-place (25)–(292)(9)––––(326)
------------------------------------------------------------------------------------------------------------------------------------------------------------------------------------------------------------------------------------------------------------------------------------------------------------
(493) (27) (284) (938) (273) (227) – (38) (2,280)
At 31 December 2006c
Developed 1,968 242 10,438 3,932 1,359 1,032 – 331 19,302
Undeveloped 825 56 4,660 9,194 5,202 1,675 – 1,254 22,866
------------------------------------------------------------------------------------------------------------------------------------------------------------------------------------------------------------------------------------------------------------------------------------------------------------
2,793 298 15,098 13,126 6,561 2,707 – 1,585 42,168
Equity-accounted entities (BP share)
At 1 January 2006
Developed – – – 1,492 50 – 1,089 130 2,761
Undeveloped – – – 848 26 – 169 52 1,095
------------------------------------------------------------------------------------------------------------------------------------------------------------------------------------------------------------------------------------------------------------------------------------------------------------
– – – 2,340 76 – 1,258 182 3,856
Changes attributable to
Revisions of previous estimates – – – 7 13 – 217 47 284
Purchases of reserves-in-place –––––––––
Extensions, discoveries and other additions –––23––––23
Improved recovery –––731–––74
Productionb– – – (171) (15) – (204) (7) (397)
Sales of reserves-in-place –––(77)––––(77)
------------------------------------------------------------------------------------------------------------------------------------------------------------------------------------------------------------------------------------------------------------------------------------------------------------
– – – (145) (1) – 13 40 (93)
At 31 December 2006d
Developed – – – 1,460 52 – 1,087 170 2,769
Undeveloped – – – 735 23 – 184 52 994
------------------------------------------------------------------------------------------------------------------------------------------------------------------------------------------------------------------------------------------------------------------------------------------------------------
– – – 2,195 75 – 1,271 222 3,763
aNet proved reserves of natural gas exclude production royalties due to others, whether royalty is payable in cash or in kind.
bIncludes 178 billion cubic feet of natural gas consumed in operations, 147 billion cubic feet in subsidiaries, 31 billion cubic feet in equity-accounted entities and excludes
8.3 billion cubic feet of produced non-hydrocarbon components which meet regulatory requirements for sales.
cIncludes 3,537 billion cubic feet of natural gas in respect of the 30% minority interest in BP Trinidad and Tobago LLC.
dIncludes 99 billion cubic feet of natural gas in respect of the 7.77% minority interest in TNK-BP.