BP 2006 Annual Report Download - page 35
Download and view the complete annual report
Please find page 35 of the 2006 BP annual report below. You can navigate through the pages in the report by either clicking on the pages listed below, or by using the keyword search tool below to find specific information within the annual report.-
 1
1 -
2
-
3
-
4
-
5
-
6
-
7
-
8
-
9
-
10
-
11
-
12
-
13
-
14
-
15
-
16
-
17
-
18
-
19
-
20
-
21
-
22
-
23
-
24
-
 25
25 -
 26
26 -
 27
27 -
 28
28 -
 29
29 -
 30
30 -
 31
31 -
 32
32 -
 33
33 -
 34
34 -
 35
35 -
 36
36 -
 37
37 -
 38
38 -
 39
39 -
 40
40 -
 41
41 -
 42
42 -
 43
43 -
 44
44 -
 45
45 -
46
-
47
-
48
-
49
-
50
-
51
-
52
-
53
-
54
-
55
-
56
-
57
-
58
-
59
-
60
-
61
-
62
-
63
-
64
-
65
-
66
-
67
-
68
-
69
-
70
-
71
-
72
-
73
-
74
-
75
-
76
-
77
-
78
-
79
-
80
-
81
-
82
-
83
-
84
-
85
-
86
-
87
-
88
-
89
-
90
-
91
-
92
-
93
-
94
-
95
-
96
-
97
-
98
-
99
-
100
-
101
-
102
-
103
-
104
-
105
-
106
-
107
-
108
-
109
-
110
-
111
-
112
-
113
-
114
-
115
-
116
-
117
-
118
-
119
-
120
-
121
-
122
-
123
-
124
-
125
-
126
-
127
-
128
-
129
-
130
-
131
-
132
-
133
-
134
-
135
-
136
-
137
-
138
-
139
-
140
-
141
-
142
-
143
-
144
-
145
-
146
-
147
-
148
-
149
-
150
-
151
-
152
-
153
-
154
-
155
-
156
-
157
-
158
-
159
-
160
-
161
-
162
-
163
-
164
-
165
-
166
-
167
-
168
-
169
-
170
-
171
-
172
-
173
-
174
-
175
-
176
-
177
-
178
-
179
-
180
-
181
-
182
-
183
-
184
-
185
-
186
-
187
-
188
-
189
-
190
-
191
-
192
-
193
-
194
-
195
-
196
-
197
-
198
-
199
-
200
-
201
-
202
-
203
-
204
-
205
-
206
-
207
-
208
-
209
-
210
-
211
-
212
-
213
-
214
-
215
-
216
-
217
-
218
-
219
-
220
-
221
-
222
-
223
-
224
-
225
-
226
-
227
-
228
 |
 |

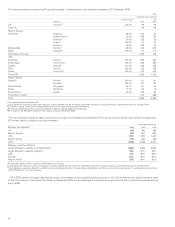
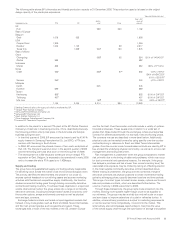
The following table shows BP’s Aromatics and Acetyls production capacity at 31 December 2006. This production capacity is based on the original
design capacity of the plants plus expansions.
thousand tonnes per year
------------------------------------------------------------------------------------------------------------------------------------------------------------------------------------------------------------------------------------------------------------------------------------------------------------
Geographic area PTA PX
Acetic
acid Other
Total – BP
share of
capacity
------------------------------------------------------------------------------------------------------------------------------------------------------------------------------------------------------------------------------------------------------------------------------------------------------------
UK
Hull 529 633 1,162
Rest of Europe
Belgium
Geel 1,076 552 1,628
USA
Cooper River 1,309 1,309
Decatur 1,043 1,145 29 2,217
Texas City 1,309 543a123 1,975
Rest of World
China
Chongqing 202b52 254 (51% of YARACO)b
Zhuhai 582 582
Indonesia
Merak 252 252 (50% of PT Ami)
Korea
Ulsan 553c242d57e852 (47% of SPC)c
(34% of ASACCO)e
(51% of SS-BP)d
Seosan 353c353 (47% of SPC)c
Malaysia
Kertih 545 545
Kuantan 699 699
Taiwan
Kaohsiung 822f822 (61% of CAPCO)f
Taichung 457f457 (61% of CAPCO)f
Mai Liao 153g153 (50% of FBPC)g
------------------------------------------------------------------------------------------------------------------------------------------------------------------------------------------------------------------------------------------------------------------------------------------------------------
7,146 3,006 2,214 894 13,260
aSterling Chemicals plant, the output of which is marketed by BP.
bYangtze River Acetyls Company.
cSamsung-Petrochemicals Company Ltd.
dSamsung-BP Chemicals Ltd.
eAsian Acetyls Company Ltd.
fChina American Petrochemical Company Ltd.
gFormosa BP Chemicals Corporation.
In addition to the plans for a second PTA plant at the BP Zhuhai Chemical
Company Limited site in Guandong province, China, described previously,
the following portfolio activity took place in the Aromatics and Acetyls
business during the year:
– In the third quarter of 2006, BP announced its intent to sell its 47.41%
equity interest in Samsung Petrochemical Co. Ltd (SPC), a PTA joint
venture with Samsung in South Korea.
– In 2004, BP announced the phased closure of two acetic acid plants at
Hull, UK. The first plant was shut down in the second quarter of 2005
and the remaining plant was shut down in the third quarter of 2006.
– The development of a 350 thousand tonnes per annum (ktepa) PTA
expansion at Geel, Belgium, is expected to be operational in early 2008
and to increase the site’s PTA capacity to 1,426ktepa.
Supply and trading
The group has a long-established supply and trading activity responsible
for delivering value across the overall crude and oil products supply chain.
This activity identifies the best markets and prices for our crude oil,
sources optimal feedstock to our refining assets and sources marketing
activities with flexible and competitive supply. Additionally, the function
creates incremental trading gains through holding commodity derivative
contracts and trading inventory. To achieve these objectives in a liquid and
volatile international market, the group enters into a range of commodity
derivative contracts, including exchange traded futures and options, over-
the-counter options, swaps and forward contracts as well as physical
term and spot contracts.
Exchange traded contracts are traded on liquid regulated markets that
transact in key crude grades, such as Brent and West Texas Intermediate,
and the main product grades, such as gasoline and gasoil. These
exchanges exist in each of the key markets in the US, western Europe
and the Far East. Over-the-counter contracts include a variety of options,
forwards and swaps. These swaps price in relation to a wider set of
grades than those traded through the exchanges, where counterparties
contract for differences between, for example, fixed and floating prices.
The contracts we use are described in more detail below. Additionally,
physical crude can be traded forward by using specific over-the-counter
contracts pricing in reference to Brent and West Texas Intermediate
grades. Over-the-counter crude forward sales contracts are used by BP to
buy and sell the underlying physical commodity, as well as to act as a risk
management and trading instrument.
Risk management is undertaken when the group is exposed to market
risk, primarily due to the timing of sales and purchases, which may occur
for both commercial and operational reasons. For example, if the group
has delayed a purchase and has a lower than normal inventory level, the
associated price exposure may be limited by taking an offsetting position
in the most suitable commodity derivative contract described above.
Where trading is undertaken, the group actively combines a range of
derivative contracts and physical positions to create incremental trading
gains by arbitraging prices, typically between locations and time periods.
This range of contract types includes futures, swaps, options and forward
sale and purchase contracts, which are described further below. The
volume of activity in 2006 was similar to 2005.
Through these transactions, the group sells crude production into the
market, allowing more suitable higher-margin crude to be supplied to
our refineries. The group may also actively buy and sell crude on a spot
and term basis to improve selections of crude for refineries further. In
addition, where refinery production is surplus to marketing requirements
or can be sourced more competitively, it is sold into the market. This
latter activity also encompasses opportunities to maximize the value
of the whole supply chain through the optimization of storage and pipeline
BP Annual Report and Accounts 2006 33