BP 2006 Annual Report Download - page 76
Download and view the complete annual report
Please find page 76 of the 2006 BP annual report below. You can navigate through the pages in the report by either clicking on the pages listed below, or by using the keyword search tool below to find specific information within the annual report.-
 1
1 -
2
-
3
-
4
-
5
-
6
-
7
-
8
-
9
-
10
-
11
-
12
-
13
-
14
-
15
-
16
-
17
-
18
-
19
-
20
-
21
-
22
-
23
-
24
-
25
-
26
-
27
-
28
-
29
-
30
-
31
-
32
-
33
-
34
-
35
-
36
-
37
-
38
-
39
-
40
-
41
-
42
-
43
-
44
-
45
-
46
-
47
-
48
-
49
-
50
-
51
-
52
-
53
-
54
-
55
-
56
-
57
-
58
-
59
-
60
-
61
-
62
-
63
-
64
-
65
-
 66
66 -
 67
67 -
 68
68 -
 69
69 -
 70
70 -
 71
71 -
 72
72 -
 73
73 -
 74
74 -
 75
75 -
 76
76 -
 77
77 -
 78
78 -
 79
79 -
 80
80 -
 81
81 -
 82
82 -
 83
83 -
 84
84 -
 85
85 -
 86
86 -
87
-
88
-
89
-
90
-
91
-
92
-
93
-
94
-
95
-
96
-
97
-
98
-
99
-
100
-
101
-
102
-
103
-
104
-
105
-
106
-
107
-
108
-
109
-
110
-
111
-
112
-
113
-
114
-
115
-
116
-
117
-
118
-
119
-
120
-
121
-
122
-
123
-
124
-
125
-
126
-
127
-
128
-
129
-
130
-
131
-
132
-
133
-
134
-
135
-
136
-
137
-
138
-
139
-
140
-
141
-
142
-
143
-
144
-
145
-
146
-
147
-
148
-
149
-
150
-
151
-
152
-
153
-
154
-
155
-
156
-
157
-
158
-
159
-
160
-
161
-
162
-
163
-
164
-
165
-
166
-
167
-
168
-
169
-
170
-
171
-
172
-
173
-
174
-
175
-
176
-
177
-
178
-
179
-
180
-
181
-
182
-
183
-
184
-
185
-
186
-
187
-
188
-
189
-
190
-
191
-
192
-
193
-
194
-
195
-
196
-
197
-
198
-
199
-
200
-
201
-
202
-
203
-
204
-
205
-
206
-
207
-
208
-
209
-
210
-
211
-
212
-
213
-
214
-
215
-
216
-
217
-
218
-
219
-
220
-
221
-
222
-
223
-
224
-
225
-
226
-
227
-
228
 |
 |

74
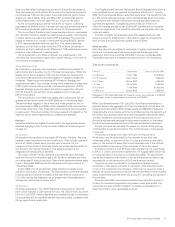
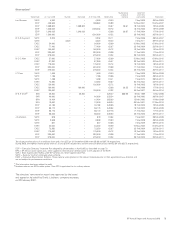
Pensionsathousand
------------------------------------------------------------------------------------------------------------------------------------------------------------------------------------------------------------------------------------------------------------------------------------------------------------
Service at
31 Dec 2006
Accrued pension
entitlement
at 31 Dec 2006
Additional pension
earned during the
year ended
31 Dec 2006b
Transfer value of
accrued benefitc
at 31 Dec 2005 (A)
Transfer value of
accrued benefitc
at 31 Dec 2006 (B)
Amount of B-A less
contributions made by
the director in 2006
------------------------------------------------------------------------------------------------------------------------------------------------------------------------------------------------------------------------------------------------------------------------------------------------------------
Lord Browne (UK) 40 years £1,050 £59 £19,979 £21,700 £1,721
------------------------------------------------------------------------------------------------------------------------------------------------------------------------------------------------------------------------------------------------------------------------------------------------------------
Dr A B Hayward (UK) 25 years £239 £31 £3,408 £4,017 £609
------------------------------------------------------------------------------------------------------------------------------------------------------------------------------------------------------------------------------------------------------------------------------------------------------------
Dr D C Allen (UK) 28 years £228 £28 £3,433 £4,006 £573
------------------------------------------------------------------------------------------------------------------------------------------------------------------------------------------------------------------------------------------------------------------------------------------------------------
I C Conn (UK) 21 years £170 £23 £2,124 £2,510 £386
------------------------------------------------------------------------------------------------------------------------------------------------------------------------------------------------------------------------------------------------------------------------------------------------------------
Dr B E Grote (US) 27 years $675 $105 $6,681 $7,591 $910
------------------------------------------------------------------------------------------------------------------------------------------------------------------------------------------------------------------------------------------------------------------------------------------------------------
J A Manzoni (UK) 23 years £188 £24 £2,518 £2,961 £443
aThis information has been subject to audit.
bAdditional pension earned during the year includes an inflation increase of 2.2% for UK directors and 3.3% for US directors.
cTransfer values have been calculated in accordance with version 8.1 of guidance note GN11 issued by the actuarial profession.
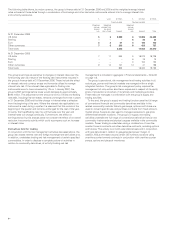
Group chief executive
As stated in previous years’ reports, Lord Browne is eligible for consideration for an ex-gratia lump sum superannuation payment equivalent to one
year’s base salary. This is in line with the company’s past practice for directors retiring on or after age 55 having accrued at least 30 years’ service. The
remuneration committee has approved the payment of this sum to Lord Browne immediately following his retirement. This payment will be in addition
to his pension entitlements under the scheme described above. No other executive director is eligible for consideration for an ex-gratia payment on
retirement because in 1996 the remuneration committee decided that appointees to the board after that time should cease to be eligible.
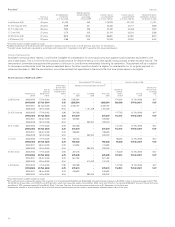
Share element of EDIP and LTPPsa
------------------------------------------------------------------------------------------------------------------------------------------------------------------------------------------------------------------------------------------------------------------------------------------------------------
Share element/LTPP interests Interests vested in 2006
------------------------------------------------------------------------------------------------------------------------------------------------------------------------------------------------------------------------------------------------------------------------------------------------------------
Market price Potential maximum performance sharesb
Performance
period
Date of
award of
performance
shares
of each share
at date of award
of performance
shares
£
At 1 Jan
2006
Awarded
2006
At 31 Dec
2006
Number of
ordinary
shares
vestedcVesting
date
Market price
of each share
at vesting
date
£
------------------------------------------------------------------------------------------------------------------------------------------------------------------------------------------------------------------------------------------------------------------------------------------------------------
Lord Browne 2003-2005 17 Feb 2003 3.96 1,265,024 – – 474,384 13 Feb 2006 6.47
2004-2006 25 Feb 2004 4.25 1,268,894 – 1,268,894 380,668 15 Feb 2007 5.37
2005-2007 28 April 2005 5.33 2,006,767 – 2,006,767 – – –
2006-2008 16 Feb 2006 6.54 – 1,761,249 1,761,249 – – –
------------------------------------------------------------------------------------------------------------------------------------------------------------------------------------------------------------------------------------------------------------------------------------------------------------
Dr A B Hayward 2003-2005 17 Feb 2003 3.96 394,088 – – 147,783 13 Feb 2006 6.47
2004-2006 25 Feb 2004 4.25 376,470 – 376,470 112,941 15 Feb 2007 5.37
2005-2007 28 Apr 2005 5.33 436,623 – 436,623 – – –
2006-2008 16 Feb 2006 6.54 – 383,200 383,200 – – –
------------------------------------------------------------------------------------------------------------------------------------------------------------------------------------------------------------------------------------------------------------------------------------------------------------
Dr D C Allen 2003-2005 17 Feb 2003 3.96 394,088 – – 147,783 13 Feb 2006 6.47
2004-2006 25 Feb 2004 4.25 376,470 – 376,470 112,941 15 Feb 2007 5.37
2005-2007 28 Apr 2005 5.33 436,623 – 436,623 – – –
2006-2008 16 Feb 2006 6.54 – 383,200 383,200 – – –
------------------------------------------------------------------------------------------------------------------------------------------------------------------------------------------------------------------------------------------------------------------------------------------------------------
I C Conn 2003-2005 17 Feb 2003 3.96 182,000 – – 68,250 13 Feb 2006 6.47
2004-2006 25 Feb 2004 4.25 182,000 – 182,000 54,600 15 Feb 2007 5.37
2005-2007 28 Apr 2005 5.33 415,832 – 415,832 – – –
2006-2008 16 Feb 2006 6.54 – 383,200 383,200 – – –
------------------------------------------------------------------------------------------------------------------------------------------------------------------------------------------------------------------------------------------------------------------------------------------------------------
Dr B E Grote 2003-2005 17 Feb 2003 3.96 467,276 – – 175,229 13 Feb 2006 6.47
2004-2006 25 Feb 2004 4.25 425,338 – 425,338 127,601 15 Feb 2007 5.37
2005-2007 28 Apr 2005 5.33 501,782 – 501,782 – – –
2006-2008 16 Feb 2006 6.54 – 470,432 470,432 – – –
------------------------------------------------------------------------------------------------------------------------------------------------------------------------------------------------------------------------------------------------------------------------------------------------------------
J A Manzoni 2003-2005 17 Feb 2003 3.96 394,088 – – 147,783 13 Feb 2006 6.47
2004-2006 25 Feb 2004 4.25 376,470 – 376,470 112,941 15 Feb 2007 5.37
2005-2007 28 Apr 2005 5.33 436,623 – 436,623 – – –
2006-2008 16 Feb 2006 6.54 – 383,200 383,200 – – –
aThis information has been subject to audit.
bBP’s performance is measured against the oil sector. For the periods 2003-2005 and 2004-2006, the performance measure is SHRAM, which is measured against the FTSE
All World Oil & Gas Index, and ROACE and EPS growth, which are measured against ExxonMobil, Shell, Total and Chevron. For periods 2005-2007 onward, the performance
condition is TSR measured against ExxonMobil, Shell, Total and Chevron. Each performance period ends on 31 December of the third year.
cRepresents awards of shares made at the end of the relevant performance period based on performance achieved under rules of the plan.
----------------------------------------------------------------------------------------------------------------------------------------------------------------------
----------------------------------------------------------------------------------------------------------------------------------------------------------------------