BP 2006 Annual Report Download - page 56
Download and view the complete annual report
Please find page 56 of the 2006 BP annual report below. You can navigate through the pages in the report by either clicking on the pages listed below, or by using the keyword search tool below to find specific information within the annual report.-
 1
1 -
2
-
3
-
4
-
5
-
6
-
7
-
8
-
9
-
10
-
11
-
12
-
13
-
14
-
15
-
16
-
17
-
18
-
19
-
20
-
21
-
22
-
23
-
24
-
25
-
26
-
27
-
28
-
29
-
30
-
31
-
32
-
33
-
34
-
35
-
36
-
37
-
38
-
39
-
40
-
41
-
42
-
43
-
44
-
45
-
 46
46 -
 47
47 -
 48
48 -
 49
49 -
 50
50 -
 51
51 -
 52
52 -
 53
53 -
 54
54 -
 55
55 -
 56
56 -
 57
57 -
 58
58 -
 59
59 -
 60
60 -
 61
61 -
 62
62 -
 63
63 -
 64
64 -
 65
65 -
 66
66 -
67
-
68
-
69
-
70
-
71
-
72
-
73
-
74
-
75
-
76
-
77
-
78
-
79
-
80
-
81
-
82
-
83
-
84
-
85
-
86
-
87
-
88
-
89
-
90
-
91
-
92
-
93
-
94
-
95
-
96
-
97
-
98
-
99
-
100
-
101
-
102
-
103
-
104
-
105
-
106
-
107
-
108
-
109
-
110
-
111
-
112
-
113
-
114
-
115
-
116
-
117
-
118
-
119
-
120
-
121
-
122
-
123
-
124
-
125
-
126
-
127
-
128
-
129
-
130
-
131
-
132
-
133
-
134
-
135
-
136
-
137
-
138
-
139
-
140
-
141
-
142
-
143
-
144
-
145
-
146
-
147
-
148
-
149
-
150
-
151
-
152
-
153
-
154
-
155
-
156
-
157
-
158
-
159
-
160
-
161
-
162
-
163
-
164
-
165
-
166
-
167
-
168
-
169
-
170
-
171
-
172
-
173
-
174
-
175
-
176
-
177
-
178
-
179
-
180
-
181
-
182
-
183
-
184
-
185
-
186
-
187
-
188
-
189
-
190
-
191
-
192
-
193
-
194
-
195
-
196
-
197
-
198
-
199
-
200
-
201
-
202
-
203
-
204
-
205
-
206
-
207
-
208
-
209
-
210
-
211
-
212
-
213
-
214
-
215
-
216
-
217
-
218
-
219
-
220
-
221
-
222
-
223
-
224
-
225
-
226
-
227
-
228
 |
 |

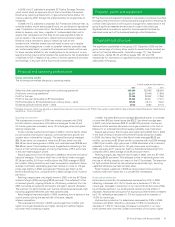
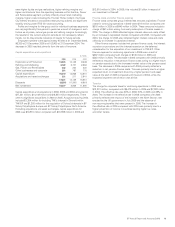
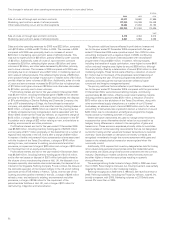
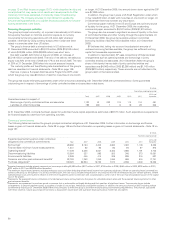
Environmental expenditure
$million
--------------------------------------------------------------------------------------------------------------------------------------------------
2006 2005 2004
--------------------------------------------------------------------------------------------------------------------------------------------------
Operating expenditure 596 494 526
Clean-ups 59 43 25
Capital expenditure 806 789 524
Additions to environmental
remediation provision 423 565 587
Additions to decommissioning
provision 2,142 1,023 286
Operating and capital expenditure on the prevention, control, abatement
or elimination of air, water and solid waste pollution is often not incurred
as a separately identifiable transaction. Instead, it forms part of a larger
transaction that includes, for example, normal maintenance expenditure.
The figures for environmental operating and capital expenditure in the
table are therefore estimates, based on the definitions and guidelines of
the American Petroleum Institute.
The increase in environmental operating expenditure in 2006 is largely
related to expenditure incurred on reducing air emissions at US refineries.
The increase in capital expenditure in 2005 compared with 2004 is largely
related to clean fuels investment. Similar levels of operating and capital
expenditures are expected in the foreseeable future. In addition to
operating and capital expenditures, we also create provisions for future
environmental remediation. Expenditure against such provisions is
normally in subsequent periods and is not included in environmental
operating expenditure reported for such periods. The charge for
environmental remediation provisions in 2006 includes $378 million
resulting from a reassessment of existing site obligations and $45 million
in respect of provisions for new sites.
Provisions for environmental remediation are made when a clean-up is
probable and the amount reasonably determinable. Generally, their timing
coincides with commitment to a formal plan of action or, if earlier, on
divestment or on closure of inactive sites.
The extent and cost of future remediation programmes are inherently
difficult to estimate. They depend on the scale of any possible
contamination, the timing and extent of corrective actions and also the
group’s share of liability. Although the cost of any future remediation
could be significant and may be material to the result of operations in the
period in which it is recognized, we do not expect that such costs will
have a material effect on the group’s financial position or liquidity. We
believe our provisions are sufficient for known requirements; and we do
not believe that our costs will differ significantly from those of other
companies engaged in similar industries, or that our competitive position
will be adversely affected as a result.
In addition, we make provisions on installation of our oil- and gas-
producing assets and related pipelines to meet the cost of eventual
decommissioning. On installation of an oil or natural gas production facility
a provision is established which represents the discounted value of the
expected future cost of decommissioning the asset. Additionally, we
undertake periodic reviews of existing provisions. These reviews take
account of revised cost assumptions, changes in decommissioning
requirements and any technological developments. The level of increase
in the decommissioning provision varies with the number of new fields
coming on stream in a particular year and the outcome of the periodic
reviews.
Provisions for environmental remediation and decommissioning are
usually set up on a discounted basis, as required by IAS 37 ‘Provisions,
Contingent Liabilities and Contingent Assets’.
Further details of decommissioning and environmental provisions
appear in Financial statements – Note 40 on page 152. See also
Environmental protection on page 42.
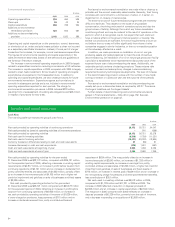
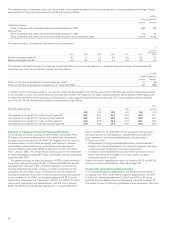
Liquidity and capital resources
Cash flow
The following table summarizes the group’s cash flows.
$million
------------------------------------------------------------------------------------------------------------------------------------------------------------------------------------------------------------------------------------------------------------------------------------------------------------
2006 2005 2004
------------------------------------------------------------------------------------------------------------------------------------------------------------------------------------------------------------------------------------------------------------------------------------------------------------
Net cash provided by operating activities of continuing operations 28,172 25,751 24,047
Net cash provided by (used in) operating activities of Innovene operations –970 (669)
------------------------------------------------------------------------------------------------------------------------------------------------------------------------------------------------------------------------------------------------------------------------------------------------------------
Net cash provided by operating activities 28,172 26,721 23,378
Net cash used in investing activities (9,518) (1,729) (11,331)
Net cash used in financing activities (19,071) (23,303) (12,835)
Currency translation differences relating to cash and cash equivalents 47 (88) 91
------------------------------------------------------------------------------------------------------------------------------------------------------------------------------------------------------------------------------------------------------------------------------------------------------------
Increase (decrease) in cash and cash equivalents (370) 1,601 (697)
Cash and cash equivalents at beginning of year 2,960 1,359 2,056
------------------------------------------------------------------------------------------------------------------------------------------------------------------------------------------------------------------------------------------------------------------------------------------------------------
Cash and cash equivalents at end of year 2,590 2,960 1,359
Net cash provided by operating activities for the year ended
31 December 2006 was $28,172 million, compared with $26,721 million
for the equivalent period of 2005, reflecting a decrease in working capital
requirements of $4,817 million, an increase in profit before taxation from
continuing operations of $2,721 million and an increase in dividends from
jointly controlled entities and associates of $1,662 million, partially offset
by an increase in income taxes paid of $4,705 million and a higher net
credit for impairment and gain/loss on sale of businesses and fixed assets
of $2,095 million.
Net cash provided by operating activities for the year ended
31 December 2005 was $26,721 million compared with $23,378 million
for the equivalent period of 2004, reflecting an increase in profit before
taxation from continuing operations of $6,955 million, an increase in
net cash provided by operating activities of Innovene of $1,639 million,
a lower charge for provisions, less payments of $710 million and an
increase in dividends received from jointly controlled entities and
associates of $634 million. This was partially offset by an increase in
income taxes paid of $2,640 million, an increase of $1,320 million in
working capital requirements, an increase in earnings from jointly
controlled entities and associates of $1,263 million, a higher net credit for
impairment and gain/loss on sale of businesses and fixed assets of
$775 million, an increase in interest paid of $429 million and an increase in
the net operating charge for pensions and other post-retirement benefits,
less contributions of $351 million.
Net cash used in investing activities was $9,518 million in 2006,
compared with $1,729 million and $11,331 in 2005 and 2004. The
increase in 2006 reflected a reduction in disposal proceeds of
$4,946 million and an increase in capital expenditure of $2,844 million.
The reduction in 2005 compared with 2004 reflected an increase in
disposal proceeds of $6,239 million, primarily from the sale of Innovene,
and a decrease in spending on acquisitions of $2,693 million.
54