BP 2006 Annual Report Download - page 167
Download and view the complete annual report
Please find page 167 of the 2006 BP annual report below. You can navigate through the pages in the report by either clicking on the pages listed below, or by using the keyword search tool below to find specific information within the annual report.-
 1
1 -
2
-
3
-
4
-
5
-
6
-
7
-
8
-
9
-
10
-
11
-
12
-
13
-
14
-
15
-
16
-
17
-
18
-
19
-
20
-
21
-
22
-
23
-
24
-
25
-
26
-
27
-
28
-
29
-
30
-
31
-
32
-
33
-
34
-
35
-
36
-
37
-
38
-
39
-
40
-
41
-
42
-
43
-
44
-
45
-
46
-
47
-
48
-
49
-
50
-
51
-
52
-
53
-
54
-
55
-
56
-
57
-
58
-
59
-
60
-
61
-
62
-
63
-
64
-
65
-
66
-
67
-
68
-
69
-
70
-
71
-
72
-
73
-
74
-
75
-
76
-
77
-
78
-
79
-
80
-
81
-
82
-
83
-
84
-
85
-
86
-
87
-
88
-
89
-
90
-
91
-
92
-
93
-
94
-
95
-
96
-
97
-
98
-
99
-
100
-
101
-
102
-
103
-
104
-
105
-
106
-
107
-
108
-
109
-
110
-
111
-
112
-
113
-
114
-
115
-
116
-
117
-
118
-
119
-
120
-
121
-
122
-
123
-
124
-
125
-
126
-
127
-
128
-
129
-
130
-
131
-
132
-
133
-
134
-
135
-
136
-
137
-
138
-
139
-
140
-
141
-
142
-
143
-
144
-
145
-
146
-
147
-
148
-
149
-
150
-
151
-
152
-
153
-
154
-
155
-
156
-
 157
157 -
 158
158 -
 159
159 -
 160
160 -
 161
161 -
 162
162 -
 163
163 -
 164
164 -
 165
165 -
 166
166 -
 167
167 -
 168
168 -
 169
169 -
 170
170 -
 171
171 -
 172
172 -
 173
173 -
 174
174 -
 175
175 -
 176
176 -
 177
177 -
178
-
179
-
180
-
181
-
182
-
183
-
184
-
185
-
186
-
187
-
188
-
189
-
190
-
191
-
192
-
193
-
194
-
195
-
196
-
197
-
198
-
199
-
200
-
201
-
202
-
203
-
204
-
205
-
206
-
207
-
208
-
209
-
210
-
211
-
212
-
213
-
214
-
215
-
216
-
217
-
218
-
219
-
220
-
221
-
222
-
223
-
224
-
225
-
226
-
227
-
228
 |
 |

BP Annual Report and Accounts 2006 165
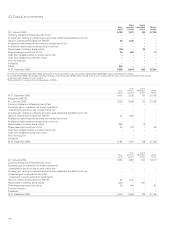
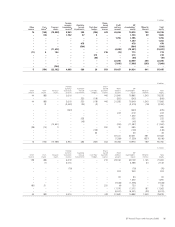
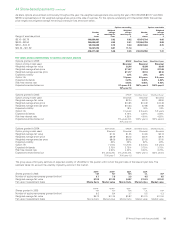
44 Share-based payments continued
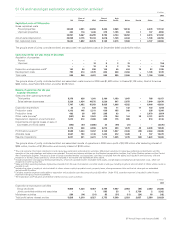
As share options are exercised continuously throughout the year, the weighted average share price during the year of $11.85 (2005 $10.77 and 2004
$8.95) is representative of the weighted average share price at the date of exercise. For the options outstanding at 31 December 2006, the exercise
price ranges and weighted average remaining contractual lives are shown below.
------------------------------------------------------------------------------------------------------------------------------------------------------------------------------------------------------------------------------------------------------------------------------------------------------------
Options outstanding Options exercisable
------------------------------------------------------------------------------------------------------------------------------------------------------------------------------------------------------------------------------------------------------------------------------------------------------------
Range of exercise prices
Number
of
shares
Weighted
average
remaining life
Years
Weighted
average
exercise price
$
Number
of
shares
Weighted
average
exercise price
$
------------------------------------------------------------------------------------------------------------------------------------------------------------------------------------------------------------------------------------------------------------------------------------------------------------
$5.10 – $6.79 100,854,491 3.92 6.02 87,474,704 6.06
$6.80 – $8.50 196,009,067 4.93 8.01 122,344,799 8.08
$8.51 – $10.21 55,376,829 5.79 9.30 26,907,463 8.76
$10.22 – $11.92 74,231,075 8.81 11.14 – –
------------------------------------------------------------------------------------------------------------------------------------------------------------------------------------------------------------------------------------------------------------------------------------------------------------
426,471,462 5.48 8.25 236,726,966 7.41
Fair values and associated details for options and shares granted
------------------------------------------------------------------------------------------------------------------------------------------------------------------------------------------------------------------------------------------------------------------------------------------------------------
Options granted in 2006 BPSOP ShareSave 3 year ShareSave 5 year
------------------------------------------------------------------------------------------------------------------------------------------------------------------------------------------------------------------------------------------------------------------------------------------------------------
Option pricing model used Binomial Binomial Binomial
Weighted average fair value $2.46 $2.88 $3.08
Weighted average share price $11.07 $11.08 $11.08
Weighted average exercise price $11.17 $9.10 $9.10
Expected volatility 22% 24% 24%
Option life 10 years 3.5 years 5.5 years
Expected dividends 3.23% 3.40% 3.40%
Risk free interest rate 4.50% 5.00% 4.75%
Expected exercise behaviour 5% years 4-9, 100% year 4 100% year 6
70% year 10
------------------------------------------------------------------------------------------------------------------------------------------------------------------------------------------------------------------------------------------------------------------------------------------------------------
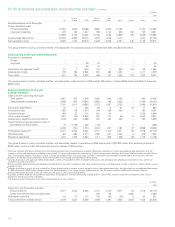
Options granted in 2005 BPSOP ShareSave 3 year ShareSave 5 year
------------------------------------------------------------------------------------------------------------------------------------------------------------------------------------------------------------------------------------------------------------------------------------------------------------
Option pricing model used Binomial Binomial Binomial
Weighted average fair value $2.34 $2.76 $2.94
Weighted average share price $10.85 $10.49 $10.49
Weighted average exercise price $10.63 $7.96 $7.96
Expected volatility 18% 18% 18%
Option life 10 years 3.5 years 5.5 years
Expected dividends 2.72% 3.00% 3.00%
Risk free interest rate 4.25% 4.00% 4.25%
Expected exercise behaviour 5% years 4-9, 100% year 4 100% year 6
70% year 10
------------------------------------------------------------------------------------------------------------------------------------------------------------------------------------------------------------------------------------------------------------------------------------------------------------
Options granted in 2004 EDIP Options BPSOP ShareSave 3 year ShareSave 5 year
------------------------------------------------------------------------------------------------------------------------------------------------------------------------------------------------------------------------------------------------------------------------------------------------------------
Option pricing model used Binomial Binomial Binomial Binomial
Weighted average fair value $1.34 $1.55 $1.94 $2.13
Weighted average share price $8.09 $8.12 $8.75 $8.75
Weighted average exercise price $8.09 $8.09 $7.00 $7.00
Expected volatility 22% 22% 22% 22%
Option life 7 years 10 years 3.5 years 5.5 years
Expected dividends 3.75% 3.75% 3.75% 3.75%
Risk free interest rate 3.50% 4.00% 3.00% 3.75%
Expected exercise behaviour 5% years 2-6, 5% years 4-9, 100% year 4 100% year 6
75% year 7 70% year 10
The group uses a third party estimate of expected volatility of US ADSs for the quarter within which the grant date of the relevant plan falls. This
estimate takes into account the volatility implied by options in the market.
------------------------------------------------------------------------------------------------------------------------------------------------------------------------------------------------------------------------------------------------------------------------------------------------------------
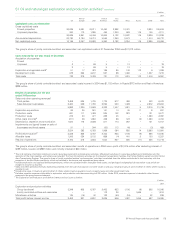
Shares granted in 2006 MTPP-
TSR
MTPP-
FCF
EDIP-
TSR
EDIP-
LTL RSP
------------------------------------------------------------------------------------------------------------------------------------------------------------------------------------------------------------------------------------------------------------------------------------------------------------
Number of equity instruments granted (million) 8.7 7.8 3.3 0.5 0.5
Weighted average fair value $7.28 $11.23 $4.87 $11.23 $11.07
Fair value measurement basis Monte Carlo Market value Monte Carlo Market value Market value
------------------------------------------------------------------------------------------------------------------------------------------------------------------------------------------------------------------------------------------------------------------------------------------------------------
Shares granted in 2005 MTPP -
TSR
MTPP -
FCF
EDIP -
TSR
EDIP -
LTL RSP
------------------------------------------------------------------------------------------------------------------------------------------------------------------------------------------------------------------------------------------------------------------------------------------------------------
Number of equity instruments granted (million) 9.3 8.4 3.7 0.5 0.3
Weighted average fair value $5.72 $11.04 $3.87 $10.13 $11.04
Fair value measurement basis Monte Carlo Market value Monte Carlo Market value Market value