BP 2006 Annual Report Download - page 136
Download and view the complete annual report
Please find page 136 of the 2006 BP annual report below. You can navigate through the pages in the report by either clicking on the pages listed below, or by using the keyword search tool below to find specific information within the annual report.-
 1
1 -
2
-
3
-
4
-
5
-
6
-
7
-
8
-
9
-
10
-
11
-
12
-
13
-
14
-
15
-
16
-
17
-
18
-
19
-
20
-
21
-
22
-
23
-
24
-
25
-
26
-
27
-
28
-
29
-
30
-
31
-
32
-
33
-
34
-
35
-
36
-
37
-
38
-
39
-
40
-
41
-
42
-
43
-
44
-
45
-
46
-
47
-
48
-
49
-
50
-
51
-
52
-
53
-
54
-
55
-
56
-
57
-
58
-
59
-
60
-
61
-
62
-
63
-
64
-
65
-
66
-
67
-
68
-
69
-
70
-
71
-
72
-
73
-
74
-
75
-
76
-
77
-
78
-
79
-
80
-
81
-
82
-
83
-
84
-
85
-
86
-
87
-
88
-
89
-
90
-
91
-
92
-
93
-
94
-
95
-
96
-
97
-
98
-
99
-
100
-
101
-
102
-
103
-
104
-
105
-
106
-
107
-
108
-
109
-
110
-
111
-
112
-
113
-
114
-
115
-
116
-
117
-
118
-
119
-
120
-
121
-
122
-
123
-
124
-
125
-
 126
126 -
 127
127 -
 128
128 -
 129
129 -
 130
130 -
 131
131 -
 132
132 -
 133
133 -
 134
134 -
 135
135 -
 136
136 -
 137
137 -
 138
138 -
 139
139 -
 140
140 -
 141
141 -
 142
142 -
 143
143 -
 144
144 -
 145
145 -
 146
146 -
147
-
148
-
149
-
150
-
151
-
152
-
153
-
154
-
155
-
156
-
157
-
158
-
159
-
160
-
161
-
162
-
163
-
164
-
165
-
166
-
167
-
168
-
169
-
170
-
171
-
172
-
173
-
174
-
175
-
176
-
177
-
178
-
179
-
180
-
181
-
182
-
183
-
184
-
185
-
186
-
187
-
188
-
189
-
190
-
191
-
192
-
193
-
194
-
195
-
196
-
197
-
198
-
199
-
200
-
201
-
202
-
203
-
204
-
205
-
206
-
207
-
208
-
209
-
210
-
211
-
212
-
213
-
214
-
215
-
216
-
217
-
218
-
219
-
220
-
221
-
222
-
223
-
224
-
225
-
226
-
227
-
228
 |
 |

134
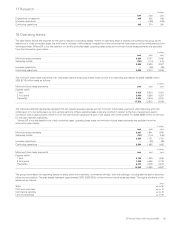
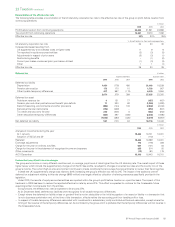
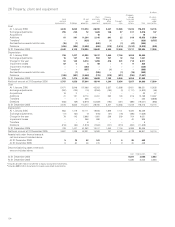
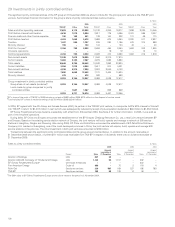
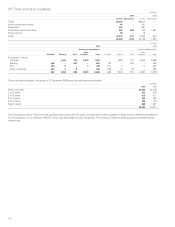
26 Property, plant and equipment
$ million
------------------------------------------------------------------------------------------------------------------------------------------------------------------------------------------------------------------------------------------------------------------------------------------------------------
Land
and land
improvements Buildings
Oil and
gas
properties
Plant,
machinery
and
equipment
Fixtures,
fittings and
office
equipment
Transport-
ation
Oil depots,
storage
tanks and
service
stations Total
Of which:
assets
under
construction
------------------------------------------------------------------------------------------------------------------------------------------------------------------------------------------------------------------------------------------------------------------------------------------------------------
Cost
At 1 January 2006 4,576 2,835 113,474 28,780 2,247 13,266 11,235 176,413 16,115
Exchange adjustments 255 239 72 1,028 138 27 517 2,276 137
Acquisitions –––16–––16–
Additions 81 381 11,264 2,146 841 22 918 15,653 11,560
Transfersa– – (628) – (1) – – (629) (9,787)
Reclassified as assets held for sale (15) (1) – (842) – (1) (47) (906) –
Deletions (455) (325) (5,628) (486) (219) (1,314) (1,412) (9,839) (225)
------------------------------------------------------------------------------------------------------------------------------------------------------------------------------------------------------------------------------------------------------------------------------------------------------------
At 31 December 2006 4,442 3,129 118,554 30,642 3,006 12,000 11,211 182,984 17,800
Depreciation
At 1 January 2006 709 1,437 61,253 13,417 1,450 7,104 5,096 90,466
Exchange adjustments 15 147 54 552 107 12 154 1,041
Charge for the year 52 149 6,214 1,059 418 301 718 8,911
Impairment losses 87 5 4 98 – 1 9 204
Impairment reversals ––(340)––––(340)
Transfersb– – (887) – (1) – – (888)
Reclassified as assets held for sale – (1) – (325) – (1) (15) (342)
Deletions (188) (267) (5,048) (173) (212) (471) (708) (7,067)
------------------------------------------------------------------------------------------------------------------------------------------------------------------------------------------------------------------------------------------------------------------------------------------------------------
At 31 December 2006 675 1,470 61,250 14,628 1,762 6,946 5,254 91,985
Net book amount at 31 December 2006 3,767 1,659 57,304 16,014 1,244 5,054 5,957 90,999 17,800
Cost
At 1 January 2005 5,471 2,846 107,066 42,302 2,827 13,588 12,421 186,521 15,038
Exchange adjustments (387) (136) (15) (2,364) (180) (4) (1,117) (4,203) (66)
Acquisitions 19 3 – – 1 – – 23 27
Additions 41 191 8,773 2,451 383 133 816 12,788 10,467
Transfers ––325––––325(8,668)
Deletions (568) (69) (2,675) (13,609) (784) (451) (885) (19,041) (683)
------------------------------------------------------------------------------------------------------------------------------------------------------------------------------------------------------------------------------------------------------------------------------------------------------------
At 31 December 2005 4,576 2,835 113,474 28,780 2,247 13,266 11,235 176,413 16,115
Depreciation
At 1 January 2005 863 1,419 57,111 19,556 1,859 7,141 5,480 93,429
Exchange adjustments (17) (60) (7) (916) (67) (76) (496) (1,639)
Charge for the year 79 143 5,696 1,691 399 309 704 9,021
Impairment losses – – 266 590 – – 42 898
Transfers ––6––––6
Deletions (216) (65) (1,819) (7,504) (741) (270) (634) (11,249)
------------------------------------------------------------------------------------------------------------------------------------------------------------------------------------------------------------------------------------------------------------------------------------------------------------
At 31 December 2005 709 1,437 61,253 13,417 1,450 7,104 5,096 90,466
Net book amount at 31 December 2005 3,867 1,398 52,221 15,363 797 6,162 6,139 85,947 16,115
Assets held under finance leases at
net book amount included above
At 31 December 2006 5 18 42 341 1 9 29 445
At 31 December 2005 8 24 46 315 2 9 35 439
Decommissioning asset at net book
amount included above
------------------------------------------------------------------------------------------------------------------------------------------------------------------------------------------------------------------------------------------------------------------------------------------------------------
Cost Depreciation Net
------------------------------------------------------------------------------------------------------------------------------------------------------------------------------------------------------------------------------------------------------------------------------------------------------------
At 31 December 2006 6,391 2,558 3,833
At 31 December 2005 5,398 2,342 3,056
aIncludes $1,087 million transferred to equity-accounted investments.
bIncludes $890 million transferred to equity-accounted investments.