BP 2006 Annual Report Download - page 145
Download and view the complete annual report
Please find page 145 of the 2006 BP annual report below. You can navigate through the pages in the report by either clicking on the pages listed below, or by using the keyword search tool below to find specific information within the annual report.-
 1
1 -
2
-
3
-
4
-
5
-
6
-
7
-
8
-
9
-
10
-
11
-
12
-
13
-
14
-
15
-
16
-
17
-
18
-
19
-
20
-
21
-
22
-
23
-
24
-
25
-
26
-
27
-
28
-
29
-
30
-
31
-
32
-
33
-
34
-
35
-
36
-
37
-
38
-
39
-
40
-
41
-
42
-
43
-
44
-
45
-
46
-
47
-
48
-
49
-
50
-
51
-
52
-
53
-
54
-
55
-
56
-
57
-
58
-
59
-
60
-
61
-
62
-
63
-
64
-
65
-
66
-
67
-
68
-
69
-
70
-
71
-
72
-
73
-
74
-
75
-
76
-
77
-
78
-
79
-
80
-
81
-
82
-
83
-
84
-
85
-
86
-
87
-
88
-
89
-
90
-
91
-
92
-
93
-
94
-
95
-
96
-
97
-
98
-
99
-
100
-
101
-
102
-
103
-
104
-
105
-
106
-
107
-
108
-
109
-
110
-
111
-
112
-
113
-
114
-
115
-
116
-
117
-
118
-
119
-
120
-
121
-
122
-
123
-
124
-
125
-
126
-
127
-
128
-
129
-
130
-
131
-
132
-
133
-
134
-
 135
135 -
 136
136 -
 137
137 -
 138
138 -
 139
139 -
 140
140 -
 141
141 -
 142
142 -
 143
143 -
 144
144 -
 145
145 -
 146
146 -
 147
147 -
 148
148 -
 149
149 -
 150
150 -
 151
151 -
 152
152 -
 153
153 -
 154
154 -
 155
155 -
156
-
157
-
158
-
159
-
160
-
161
-
162
-
163
-
164
-
165
-
166
-
167
-
168
-
169
-
170
-
171
-
172
-
173
-
174
-
175
-
176
-
177
-
178
-
179
-
180
-
181
-
182
-
183
-
184
-
185
-
186
-
187
-
188
-
189
-
190
-
191
-
192
-
193
-
194
-
195
-
196
-
197
-
198
-
199
-
200
-
201
-
202
-
203
-
204
-
205
-
206
-
207
-
208
-
209
-
210
-
211
-
212
-
213
-
214
-
215
-
216
-
217
-
218
-
219
-
220
-
221
-
222
-
223
-
224
-
225
-
226
-
227
-
228
 |
 |

BP Annual Report and Accounts 2006 143
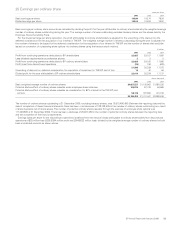
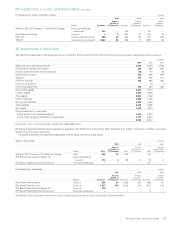
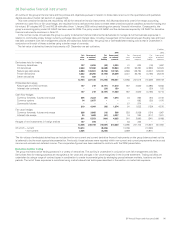
36 Derivative financial instruments continued
$ million
------------------------------------------------------------------------------------------------------------------------------------------------------------------------------------------------------------------------------------------------------------------------------------------------------------
2005
------------------------------------------------------------------------------------------------------------------------------------------------------------------------------------------------------------------------------------------------------------------------------------------------------------
Less than
1 year 1-2 years 2-3 years 3-4 years 4-5 years
Over
5 years Total
------------------------------------------------------------------------------------------------------------------------------------------------------------------------------------------------------------------------------------------------------------------------------------------------------------
Currency derivatives
Fair value 286111441
Notional value 3587351283292634
Oil price derivatives
Fair value 2,476 225 37 19 8 – 2,765
Notional value 52,260 3,378 676 45 35 – 56,394
Natural gas price derivatives
Fair value 4,509 1,194 528 292 125 188 6,836
Notional value 113,897 17,562 8,560 4,021 2,068 2,686 148,794
Power price derivatives
Fair value 2,474 594 119 143 11 – 3,341
Notional value 19,156 5,049 857 535 196 – 25,793
Total derivative assets held for trading
Fair value 9,487 2,019 685 455 145 192 12,983
Notional value 185,671 26,062 10,144 4,629 2,331 2,778 231,615
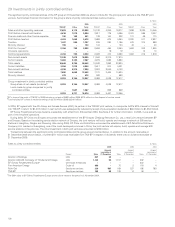
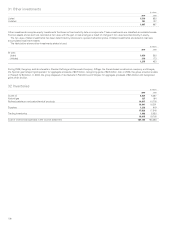
Derivative liabilities held for trading have the following fair values, contractual or notional values and maturities.
$ million
------------------------------------------------------------------------------------------------------------------------------------------------------------------------------------------------------------------------------------------------------------------------------------------------------------
2006
------------------------------------------------------------------------------------------------------------------------------------------------------------------------------------------------------------------------------------------------------------------------------------------------------------
Less than
1 year 1-2 years 2-3 years 3-4 years 4-5 years
Over
5 years Total
------------------------------------------------------------------------------------------------------------------------------------------------------------------------------------------------------------------------------------------------------------------------------------------------------------
Currency derivatives
Fair value (8) (7) (12) (2) (2) (1) (32)
Notional value 3,183 204 214 92 56 174 3,923
Oil price derivatives
Fair value (2,230) (89) (29) (19) (1) – (2,368)
Notional value 55,488 3,541 363 111 21 – 59,524
Natural gas price derivatives
Fair value (3,931) (875) (273) (109) (86) (429) (5,703)
Notional value 63,593 25,962 7,710 3,059 1,591 5,230 107,145
Power price derivatives
Fair value (2,777) (289) (98) (26) – – (3,190)
Notional value 20,086 4,457 1,299 17 – – 25,859
Total derivative liabilities held for trading
Fair value (8,946) (1,260) (412) (156) (89) (430) (11,293)
Notional value 142,350 34,164 9,586 3,279 1,668 5,404 196,451
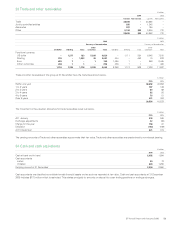
$ million
------------------------------------------------------------------------------------------------------------------------------------------------------------------------------------------------------------------------------------------------------------------------------------------------------------
2005
------------------------------------------------------------------------------------------------------------------------------------------------------------------------------------------------------------------------------------------------------------------------------------------------------------
Less than
1 year 1-2 years 2-3 years 3-4 years 4-5 years
Over
5 years Total
------------------------------------------------------------------------------------------------------------------------------------------------------------------------------------------------------------------------------------------------------------------------------------------------------------
Currency derivatives
Fair value (12) (4) (1) (1) – – (18)
Notional value 1,013 177 119 170 67 141 1,687
Oil price derivatives
Fair value (2,486) (275) (26) (20) (19) – (2,826)
Notional value 49,732 2,276 446 35 35 – 52,524
Natural gas price derivatives
Fair value (3,967) (1,319) (591) (187) (89) (154) (6,307)
Notional value 90,916 25,269 6,457 2,903 1,577 1,208 128,330
Power price derivatives
Fair value (2,459) (557) (59) (70) (13) – (3,158)
Notional value 20,030 4,990 778 625 195 – 26,618
Total derivative liabilities held for trading
Fair value (8,924) (2,155) (677) (278) (121) (154) (12,309)
Notional value 161,691 32,712 7,800 3,733 1,874 1,349 209,159