BP 2006 Annual Report Download - page 171
Download and view the complete annual report
Please find page 171 of the 2006 BP annual report below. You can navigate through the pages in the report by either clicking on the pages listed below, or by using the keyword search tool below to find specific information within the annual report.-
 1
1 -
2
-
3
-
4
-
5
-
6
-
7
-
8
-
9
-
10
-
11
-
12
-
13
-
14
-
15
-
16
-
17
-
18
-
19
-
20
-
21
-
22
-
23
-
24
-
25
-
26
-
27
-
28
-
29
-
30
-
31
-
32
-
33
-
34
-
35
-
36
-
37
-
38
-
39
-
40
-
41
-
42
-
43
-
44
-
45
-
46
-
47
-
48
-
49
-
50
-
51
-
52
-
53
-
54
-
55
-
56
-
57
-
58
-
59
-
60
-
61
-
62
-
63
-
64
-
65
-
66
-
67
-
68
-
69
-
70
-
71
-
72
-
73
-
74
-
75
-
76
-
77
-
78
-
79
-
80
-
81
-
82
-
83
-
84
-
85
-
86
-
87
-
88
-
89
-
90
-
91
-
92
-
93
-
94
-
95
-
96
-
97
-
98
-
99
-
100
-
101
-
102
-
103
-
104
-
105
-
106
-
107
-
108
-
109
-
110
-
111
-
112
-
113
-
114
-
115
-
116
-
117
-
118
-
119
-
120
-
121
-
122
-
123
-
124
-
125
-
126
-
127
-
128
-
129
-
130
-
131
-
132
-
133
-
134
-
135
-
136
-
137
-
138
-
139
-
140
-
141
-
142
-
143
-
144
-
145
-
146
-
147
-
148
-
149
-
150
-
151
-
152
-
153
-
154
-
155
-
156
-
157
-
158
-
159
-
160
-
 161
161 -
 162
162 -
 163
163 -
 164
164 -
 165
165 -
 166
166 -
 167
167 -
 168
168 -
 169
169 -
 170
170 -
 171
171 -
 172
172 -
 173
173 -
 174
174 -
 175
175 -
 176
176 -
 177
177 -
 178
178 -
 179
179 -
 180
180 -
 181
181 -
182
-
183
-
184
-
185
-
186
-
187
-
188
-
189
-
190
-
191
-
192
-
193
-
194
-
195
-
196
-
197
-
198
-
199
-
200
-
201
-
202
-
203
-
204
-
205
-
206
-
207
-
208
-
209
-
210
-
211
-
212
-
213
-
214
-
215
-
216
-
217
-
218
-
219
-
220
-
221
-
222
-
223
-
224
-
225
-
226
-
227
-
228
 |
 |

BP Annual Report and Accounts 2006 169
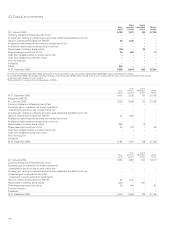
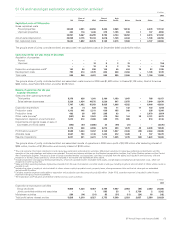
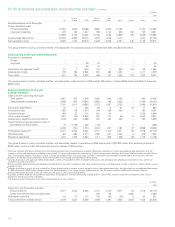
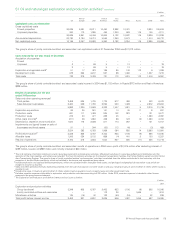
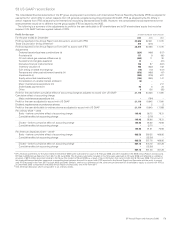
49 First-time adoption of International Financial Reporting Standards continued
The reconciliation set out below shows the adjustments to the group balance sheet at 1 January 2005 on the adoption of IAS 32 and IAS 39.
------------------------------------------------------------------------------------------------------------------------------------------------------------------------------------------------------------------------------------------------------------------------------------------------------------
Group balance sheet reconcilation $ million
------------------------------------------------------------------------------------------------------------------------------------------------------------------------------------------------------------------------------------------------------------------------------------------------------------
IFRS at
31 December
2004
Fair value
hedges
Cash flow
hedges
Non-
qualifying
hedge
derivatives
Other
non-
financial
contracts
at fair
value
Other
non-
financial
contracts
no longer
at fair value
Available-
for-sale
financial
assets
Embedded
derivatives
Elimination
of
deferred
gains/
losses
Total
IAS 39
adjustments
IFRS at
1January
2005
------------------------------------------------------------------------------------------------------------------------------------------------------------------------------------------------------------------------------------------------------------------------------------------------------------
Non-current assets
Property, plant and equipment 93,092–––––––– –93,092
Goodwill 10,857–––––––– –10,857
Intangible assets 4,205–––––––– –4,205
Investments in jointly controlled entities 14,556–––––––– –14,556
Investments in associates 5,486–––––––– –5,486
Other investments 394–––––344––344738
------------------------------------------------------------------------------------------------------------------------------------------------------------------------------------------------------------------------------------------------------------------------------------------------------------
Fixed assets 128,590–––––344––344128,934
Loans 811–––––––– –811
Other receivables 429–––––––– –429
Derivative financial instruments 898 112 79 8 110 (34) – 599 (147) 727 1,625
Prepayments and accrued income 354–––––––– –354
Defined benefit pension plan surplus 2,105–––––––– –2,105
------------------------------------------------------------------------------------------------------------------------------------------------------------------------------------------------------------------------------------------------------------------------------------------------------------
133,187 112 79 8 110 (34) 344 599 (147) 1,071 134,258
------------------------------------------------------------------------------------------------------------------------------------------------------------------------------------------------------------------------------------------------------------------------------------------------------------
Current assets
Loans 193–––––––– –193
Inventories 15,645–––––––– –15,645
Trade and other receivables 37,099–(2)––––––(2)37,097
Derivative financial instruments 5,317 – 141 178 34 47 – 278 – 678 5,995
Prepayments and accrued income 1,671–––––––– –1,671
Current tax receivable 159–––––––– –159
Cash and cash equivalents 1,359–––––––– –1,359
------------------------------------------------------------------------------------------------------------------------------------------------------------------------------------------------------------------------------------------------------------------------------------------------------------
61,443 – 139 178 34 47 – 278 – 676 62,119
------------------------------------------------------------------------------------------------------------------------------------------------------------------------------------------------------------------------------------------------------------------------------------------------------------
Total assets 194,630 112 218 186 144 13 344 877 (147) 1,747 196,377
Current liabilities
Trade and other payables 38,540–––––––– –38,540
Derivative financial instruments 5,074 – 16 210 14 – – 402 – 642 5,716
Accruals and deferred income 4,482–––––––– –4,482
Finance debt 10,184–––––––– –10,184
Current tax payable 4,131–––––––– –4,131
Provisions 715–––––––– –715
------------------------------------------------------------------------------------------------------------------------------------------------------------------------------------------------------------------------------------------------------------------------------------------------------------
63,126 – 16 210 14 – – 402 – 642 63,768
------------------------------------------------------------------------------------------------------------------------------------------------------------------------------------------------------------------------------------------------------------------------------------------------------------
Non-current liabilities
Other payables 3,581–––––––– –3,581
Derivative financial instruments 158 129 4 17 12 – – 1,151 – 1,313 1,471
Accruals and deferred income 699–––––––– –699
Finance debt 12,907(17)––––––16414713,054
Deferred tax liabilities 16,701 – 60 (13) 44 5 114 (267) (55) (112) 16,589
Provisions 8,884–––––––– –8,884
Defined benefit pension plan and other
post-retirement benefit plan deficits 10,339–––––––– –10,339
------------------------------------------------------------------------------------------------------------------------------------------------------------------------------------------------------------------------------------------------------------------------------------------------------------
53,269 112 64 4 56 5 114 884 109 1,348 54,617
------------------------------------------------------------------------------------------------------------------------------------------------------------------------------------------------------------------------------------------------------------------------------------------------------------
Total liabilities 116,395 112 80 214 70 5 114 1,286 109 1,990 118,385
Net assets 78,235 – 138 (28) 74 8 230 (409) (256) (243) 77,992
BP shareholders’ equity 76,892 – 138 (28) 74 8 230 (409) (256) (243) 76,649
Minority interest 1,343–––––––– –1,343
------------------------------------------------------------------------------------------------------------------------------------------------------------------------------------------------------------------------------------------------------------------------------------------------------------
Total equity 78,235 – 138 (28) 74 8 230 (409) (256) (243) 77,992
The fair values of embedded derivatives are included within non-current and current derivative financial instruments on the group balance sheet as this
is believed to be the most appropriate presentation. Previously, these balances were reported within non-current and current prepayments and accrued
income and accruals and deferred income.