BP 2006 Annual Report Download - page 198
Download and view the complete annual report
Please find page 198 of the 2006 BP annual report below. You can navigate through the pages in the report by either clicking on the pages listed below, or by using the keyword search tool below to find specific information within the annual report.-
 1
1 -
2
-
3
-
4
-
5
-
6
-
7
-
8
-
9
-
10
-
11
-
12
-
13
-
14
-
15
-
16
-
17
-
18
-
19
-
20
-
21
-
22
-
23
-
24
-
25
-
26
-
27
-
28
-
29
-
30
-
31
-
32
-
33
-
34
-
35
-
36
-
37
-
38
-
39
-
40
-
41
-
42
-
43
-
44
-
45
-
46
-
47
-
48
-
49
-
50
-
51
-
52
-
53
-
54
-
55
-
56
-
57
-
58
-
59
-
60
-
61
-
62
-
63
-
64
-
65
-
66
-
67
-
68
-
69
-
70
-
71
-
72
-
73
-
74
-
75
-
76
-
77
-
78
-
79
-
80
-
81
-
82
-
83
-
84
-
85
-
86
-
87
-
88
-
89
-
90
-
91
-
92
-
93
-
94
-
95
-
96
-
97
-
98
-
99
-
100
-
101
-
102
-
103
-
104
-
105
-
106
-
107
-
108
-
109
-
110
-
111
-
112
-
113
-
114
-
115
-
116
-
117
-
118
-
119
-
120
-
121
-
122
-
123
-
124
-
125
-
126
-
127
-
128
-
129
-
130
-
131
-
132
-
133
-
134
-
135
-
136
-
137
-
138
-
139
-
140
-
141
-
142
-
143
-
144
-
145
-
146
-
147
-
148
-
149
-
150
-
151
-
152
-
153
-
154
-
155
-
156
-
157
-
158
-
159
-
160
-
161
-
162
-
163
-
164
-
165
-
166
-
167
-
168
-
169
-
170
-
171
-
172
-
173
-
174
-
175
-
176
-
177
-
178
-
179
-
180
-
181
-
182
-
183
-
184
-
185
-
186
-
187
-
 188
188 -
 189
189 -
 190
190 -
 191
191 -
 192
192 -
 193
193 -
 194
194 -
 195
195 -
 196
196 -
 197
197 -
 198
198 -
 199
199 -
 200
200 -
 201
201 -
 202
202 -
 203
203 -
 204
204 -
 205
205 -
 206
206 -
 207
207 -
 208
208 -
209
-
210
-
211
-
212
-
213
-
214
-
215
-
216
-
217
-
218
-
219
-
220
-
221
-
222
-
223
-
224
-
225
-
226
-
227
-
228
 |
 |

196
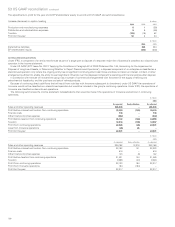
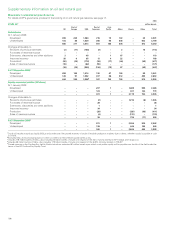
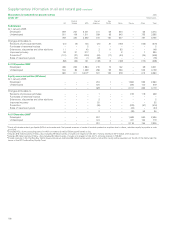
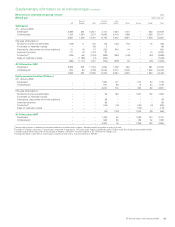
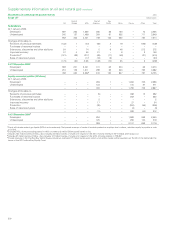
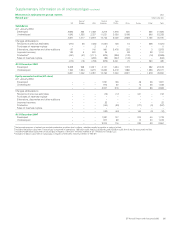
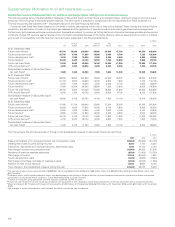
Supplementary information on oil and natural gas
Movements in estimated net proved reserves
For details of BP’s governance process for the booking of oil and natural gas reserves, see page 17.
2006
------------------------------------------------------------------------------------------------------------------------------------------------------------------------------------------------------------------------------------------------------------------------------------------------------------
Crude oilamillion barrels
------------------------------------------------------------------------------------------------------------------------------------------------------------------------------------------------------------------------------------------------------------------------------------------------------------
UK
Rest of
Europe USA
Rest of
Americas
Asia
Pacific Africa Russia Other Total
------------------------------------------------------------------------------------------------------------------------------------------------------------------------------------------------------------------------------------------------------------------------------------------------------------
Subsidiaries
At 1 January 2006
Developed 496 225 1,984 215 70 142 – 69 3,201
Undeveloped 184 86 1,429 286 95 536 – 543 3,159
------------------------------------------------------------------------------------------------------------------------------------------------------------------------------------------------------------------------------------------------------------------------------------------------------------
680 311 3,413 501 165 678 – 612 6,360
Changes attributable to
Revisions of previous estimates (3) (11) (108) (9) – 2 – 16 (113)
Purchases of reserves-in-place –––––––––
Extensions, discoveries and other additions 3 – 48 – 1 67 – – 119
Improved recovery 26 9 95 13 4 22 – – 169
Productionb(92) (23) (178) (39) (17) (64) – (58) (471)
Sales of reserves-in-place (10)–(62)(99)––––(171)
------------------------------------------------------------------------------------------------------------------------------------------------------------------------------------------------------------------------------------------------------------------------------------------------------------
(76) (25) (205) (134) (12) 27 – (42) (467)
At 31 December 2006c
Developed 458 189 1,916 130 67 193 – 88 3,041
Undeveloped 146 97 1,292 237 86 512 – 482 2,852
------------------------------------------------------------------------------------------------------------------------------------------------------------------------------------------------------------------------------------------------------------------------------------------------------------
604 286 3,208e367 153 705 – 570 5,893
Equity-accounted entities (BP share)
At 1 January 2006
Developed – – – 207 1 – 1,688 590 2,486
Undeveloped – – 124 – – 431 164 719
------------------------------------------------------------------------------------------------------------------------------------------------------------------------------------------------------------------------------------------------------------------------------------------------------------
– – – 331 1 – 2,119 754 3,205
Changes attributable to
Revisions of previous estimates – – – (2) – – 1,215 (8) 1,205
Purchases of reserves-in-place –––28––––28
Extensions, discoveries and other additions –––1––––1
Improved recovery –––34––––34
Production – – – (28) – – (320) (63) (411)
Sales of reserves-in-place – – – (4) – – (170) – (174)
------------------------------------------------------------------------------------------------------------------------------------------------------------------------------------------------------------------------------------------------------------------------------------------------------------
– – – 29 – – 725 (71) 683
At 31 December 2006d
Developed – – – 221 1 – 2,200 520 2,942
Undeveloped – – – 139 – – 644 163 946
------------------------------------------------------------------------------------------------------------------------------------------------------------------------------------------------------------------------------------------------------------------------------------------------------------
– – – 360 1 – 2,844 683 3,888
aCrude oil includes natural gas liquids (NGLs) and condensate. Net proved reserves of crude oil exclude production royalties due to others, whether royalty is payable in cash
or in kind.
bExcludes NGLs from processing plants in which an interest is held of 55 thousand barrels a day.
cIncludes 779 million barrels of NGLs. Also includes 23 million barrels of crude oil in respect of the 30% minority interest in BP Trinidad and Tobago LLC.
dIncludes 28 million barrels of NGLs. Also includes 179 million barrels of crude oil in respect of the 6.29% minority interest in TNK-BP.
eProved reserves in the Prudhoe Bay field in Alaska include an estimated 81 million barrels upon which a net profits royalty will be payable over the life of the field under the
terms of the BP Prudhoe Bay Royalty Trust.