BP 2006 Annual Report Download - page 206
Download and view the complete annual report
Please find page 206 of the 2006 BP annual report below. You can navigate through the pages in the report by either clicking on the pages listed below, or by using the keyword search tool below to find specific information within the annual report.-
 1
1 -
2
-
3
-
4
-
5
-
6
-
7
-
8
-
9
-
10
-
11
-
12
-
13
-
14
-
15
-
16
-
17
-
18
-
19
-
20
-
21
-
22
-
23
-
24
-
25
-
26
-
27
-
28
-
29
-
30
-
31
-
32
-
33
-
34
-
35
-
36
-
37
-
38
-
39
-
40
-
41
-
42
-
43
-
44
-
45
-
46
-
47
-
48
-
49
-
50
-
51
-
52
-
53
-
54
-
55
-
56
-
57
-
58
-
59
-
60
-
61
-
62
-
63
-
64
-
65
-
66
-
67
-
68
-
69
-
70
-
71
-
72
-
73
-
74
-
75
-
76
-
77
-
78
-
79
-
80
-
81
-
82
-
83
-
84
-
85
-
86
-
87
-
88
-
89
-
90
-
91
-
92
-
93
-
94
-
95
-
96
-
97
-
98
-
99
-
100
-
101
-
102
-
103
-
104
-
105
-
106
-
107
-
108
-
109
-
110
-
111
-
112
-
113
-
114
-
115
-
116
-
117
-
118
-
119
-
120
-
121
-
122
-
123
-
124
-
125
-
126
-
127
-
128
-
129
-
130
-
131
-
132
-
133
-
134
-
135
-
136
-
137
-
138
-
139
-
140
-
141
-
142
-
143
-
144
-
145
-
146
-
147
-
148
-
149
-
150
-
151
-
152
-
153
-
154
-
155
-
156
-
157
-
158
-
159
-
160
-
161
-
162
-
163
-
164
-
165
-
166
-
167
-
168
-
169
-
170
-
171
-
172
-
173
-
174
-
175
-
176
-
177
-
178
-
179
-
180
-
181
-
182
-
183
-
184
-
185
-
186
-
187
-
188
-
189
-
190
-
191
-
192
-
193
-
194
-
195
-
 196
196 -
 197
197 -
 198
198 -
 199
199 -
 200
200 -
 201
201 -
 202
202 -
 203
203 -
 204
204 -
 205
205 -
 206
206 -
 207
207 -
 208
208 -
 209
209 -
 210
210 -
 211
211 -
 212
212 -
 213
213 -
 214
214 -
 215
215 -
 216
216 -
217
-
218
-
219
-
220
-
221
-
222
-
223
-
224
-
225
-
226
-
227
-
228
 |
 |

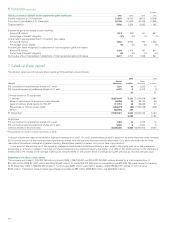
204
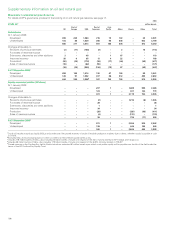
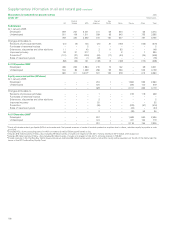
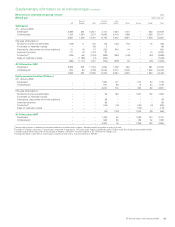
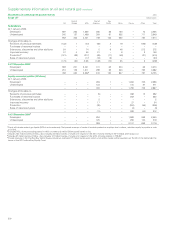
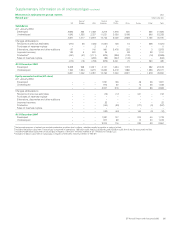
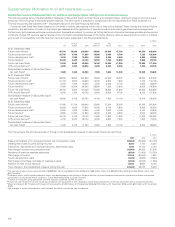
Supplementary information on oil and natural gas continued
Net oil and gas wells completed or abandoned
The following table shows the number of net productive and dry exploratory and development oil and natural gas wells completed or abandoned in the
years indicated by the group and its equity-accounted entities. Productive wells include wells in which hydrocarbons were encountered and the drilling
or completion of which, in the case of exploratory wells, has been suspended pending further drilling or evaluation. A dry well is one found to be
incapable of producing hydrocarbons in sufficient quantities to justify completion.
------------------------------------------------------------------------------------------------------------------------------------------------------------------------------------------------------------------------------------------------------------------------------------------------------------
UK
Rest of
Europe USA
Rest of
Americas
Asia
Pacific Africa Russia Other Total
------------------------------------------------------------------------------------------------------------------------------------------------------------------------------------------------------------------------------------------------------------------------------------------------------------
2006
Exploratory
Productive 0.1 0.1 2.9 0.5 1.0 3.2 15.6 1.4 24.8
Dry –– 7.4 1.0 1.5 0.5 5.7 0.3 16.4
Development
Productive 4.9 1.6 418.8 154.0 12.4 23.8 227.2 14.5 857.2
Dry – – 4.5 5.0 0.2 – 20.8 1.0 31.5
2005
Exploratory
Productive 0.5 0.8 10.7 2.0 0.3 2.0 14.5 – 30.8
Dry 0.3 – 6.4 1.0 0.3 1.3 5.2 – 14.5
Development
Productive 10.6 3.5 473.9 151.7 22.7 17.9 212.8 12.1 905.2
Dry – 0.3 5.0 3.3 0.4 1.0 17.7 0.3 28.0
2004
Exploratory
Productive – – 2.1 1.3 – 6.6 11.0 1.3 22.3
Dry – – 3.2 1.5 – 2.0 5.2 1.1 13.0
Development
Productive 10.0 0.3 513.3 138.2 8.6 12.9 166.8 16.0 866.1
Dry 0.1 – 3.0 1.8 – 2.0 8.7 2.4 18.0
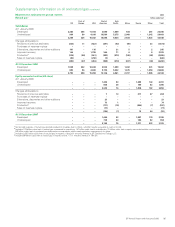
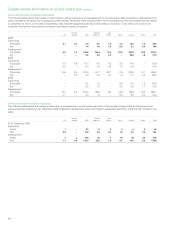
Drilling and production activities in progress
The following table shows the number of exploratory and development oil and natural gas wells in the process of being drilled by the group and its
equity-accounted entities as of 31 December 2006. Suspended development wells and long-term suspended exploratory wells are also included in the
table.
------------------------------------------------------------------------------------------------------------------------------------------------------------------------------------------------------------------------------------------------------------------------------------------------------------
UK
Rest of
Europe USA
Rest of
Americas
Asia
Pacific Africa Russia Other Total
------------------------------------------------------------------------------------------------------------------------------------------------------------------------------------------------------------------------------------------------------------------------------------------------------------
At 31 December 2006
Exploratory
Gross 1–226246243
Net 0.5 – 10.8 2.8 0.3 1.6 2.2 0.5 18.7
Development
Gross 3 2 194 43 7 19 30 20 318
Net 1.1 0.6 110.6 25.2 1.8 6.7 12.5 5.3 163.8