BP 2006 Annual Report Download - page 151
Download and view the complete annual report
Please find page 151 of the 2006 BP annual report below. You can navigate through the pages in the report by either clicking on the pages listed below, or by using the keyword search tool below to find specific information within the annual report.-
 1
1 -
2
-
3
-
4
-
5
-
6
-
7
-
8
-
9
-
10
-
11
-
12
-
13
-
14
-
15
-
16
-
17
-
18
-
19
-
20
-
21
-
22
-
23
-
24
-
25
-
26
-
27
-
28
-
29
-
30
-
31
-
32
-
33
-
34
-
35
-
36
-
37
-
38
-
39
-
40
-
41
-
42
-
43
-
44
-
45
-
46
-
47
-
48
-
49
-
50
-
51
-
52
-
53
-
54
-
55
-
56
-
57
-
58
-
59
-
60
-
61
-
62
-
63
-
64
-
65
-
66
-
67
-
68
-
69
-
70
-
71
-
72
-
73
-
74
-
75
-
76
-
77
-
78
-
79
-
80
-
81
-
82
-
83
-
84
-
85
-
86
-
87
-
88
-
89
-
90
-
91
-
92
-
93
-
94
-
95
-
96
-
97
-
98
-
99
-
100
-
101
-
102
-
103
-
104
-
105
-
106
-
107
-
108
-
109
-
110
-
111
-
112
-
113
-
114
-
115
-
116
-
117
-
118
-
119
-
120
-
121
-
122
-
123
-
124
-
125
-
126
-
127
-
128
-
129
-
130
-
131
-
132
-
133
-
134
-
135
-
136
-
137
-
138
-
139
-
140
-
 141
141 -
 142
142 -
 143
143 -
 144
144 -
 145
145 -
 146
146 -
 147
147 -
 148
148 -
 149
149 -
 150
150 -
 151
151 -
 152
152 -
 153
153 -
 154
154 -
 155
155 -
 156
156 -
 157
157 -
 158
158 -
 159
159 -
 160
160 -
 161
161 -
162
-
163
-
164
-
165
-
166
-
167
-
168
-
169
-
170
-
171
-
172
-
173
-
174
-
175
-
176
-
177
-
178
-
179
-
180
-
181
-
182
-
183
-
184
-
185
-
186
-
187
-
188
-
189
-
190
-
191
-
192
-
193
-
194
-
195
-
196
-
197
-
198
-
199
-
200
-
201
-
202
-
203
-
204
-
205
-
206
-
207
-
208
-
209
-
210
-
211
-
212
-
213
-
214
-
215
-
216
-
217
-
218
-
219
-
220
-
221
-
222
-
223
-
224
-
225
-
226
-
227
-
228
 |
 |

BP Annual Report and Accounts 2006 149
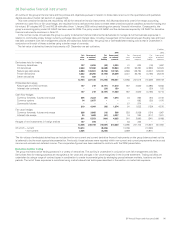
37 Derivative financial instruments (UK GAAP) continued
The group calculates value at risk on all instruments that are held for trading purposes and that therefore give an exposure to market risk. The value-
at-risk model takes account of derivative financial instruments such as interest rate forward and futures contracts, swap agreements, options and
swaptions; foreign exchange forward and futures contracts, swap agreements and options; and oil, natural gas and power price futures, swap
agreements and options. Financial assets and liabilities and physical crude oil and refined products that are treated as trading positions are also included
in these calculations. The value-at-risk calculation for oil, natural gas and power price exposure also includes cash-settled commodity contracts such as
forward contracts.
The following table shows values at risk for trading activities.
$ million
------------------------------------------------------------------------------------------------------------------------------------------------------------------------------------------------------------------------------------------------------------------------------------------------------------
2004
------------------------------------------------------------------------------------------------------------------------------------------------------------------------------------------------------------------------------------------------------------------------------------------------------------
High Low Average Year end
------------------------------------------------------------------------------------------------------------------------------------------------------------------------------------------------------------------------------------------------------------------------------------------------------------
Interest rate trading 1–––
Foreign exchange trading 4111
Oil price trading 55 18 29 45
Natural gas price trading 23 6 13 10
Power price trading 10144
The presentation of trading results shown in the table below includes certain activities of BP’s trading units that involve the use of derivative financial
instruments in conjunction with physical and paper trading of oil, natural gas and power. It is considered that a more comprehensive representation of
the group’s oil, natural gas and power price trading activities is given by aggregating the gain or loss on such derivatives together with the gain or loss
arising from the physical and paper trades to which they relate, representing the net result of the trading portfolio.
$ million
------------------------------------------------------------------------------------------------------------------------------------------------------------------------------------------------------------------------------------------------------------------------------------------------------------
2004
------------------------------------------------------------------------------------------------------------------------------------------------------------------------------------------------------------------------------------------------------------------------------------------------------------
Net gain (loss)
------------------------------------------------------------------------------------------------------------------------------------------------------------------------------------------------------------------------------------------------------------------------------------------------------------
Interest rate trading 4
Foreign exchange trading 136
Oil price trading 1,371
Natural gas price trading 461
Power price trading 160
------------------------------------------------------------------------------------------------------------------------------------------------------------------------------------------------------------------------------------------------------------------------------------------------------------
2,132
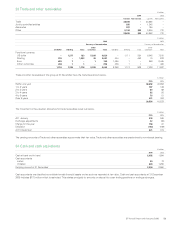
38 Finance debt
$ million
------------------------------------------------------------------------------------------------------------------------------------------------------------------------------------------------------------------------------------------------------------------------------------------------------------
2006 2005
------------------------------------------------------------------------------------------------------------------------------------------------------------------------------------------------------------------------------------------------------------------------------------------------------------
Within
1 yearaAfter
1year Total
Within
1 yearaAfter
1 year Total
------------------------------------------------------------------------------------------------------------------------------------------------------------------------------------------------------------------------------------------------------------------------------------------------------------
Bank loans 543 806 1,349 155 547 702
Other loans 12,321 9,525 21,846 8,717 8,962 17,679
------------------------------------------------------------------------------------------------------------------------------------------------------------------------------------------------------------------------------------------------------------------------------------------------------------
Total borrowings 12,864 10,331 23,195 8,872 9,509 18,381
Net obligations under finance leases 60 755 815 60 721 781
------------------------------------------------------------------------------------------------------------------------------------------------------------------------------------------------------------------------------------------------------------------------------------------------------------
12,924 11,086 24,010 8,932 10,230 19,162
aAmounts due within one year include current maturities of long-term debt.
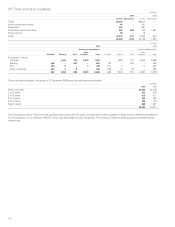
Included within Other loans repayable within one year above are US Industrial Revenue/Municipal Bonds of $2,744 million (2005 $2,462 million) with
maturity periods ranging from 1 to 34 years. They are classified as repayable within one year as the bondholders typically have the option to tender
these bonds for repayment on interest reset dates. Any bonds that are tendered are usually remarketed and BP has not experienced any significant
repurchases. BP considers these bonds to represent long-term funding when assessing the maturity profile of its finance debt and they are reflected as
such in the borrowings repayment schedule below. Similar treatment is applied for loans associated with long-term gas supply contracts totalling
$1,976 million (2005 $992 million) that mature over 10 years.
At 31 December 2006, the group had substantial amounts of undrawn borrowing facilities available, including committed facilities of $4,700 million,of
which $4,300 million are in place for at least 5 years (2005 $4,500 million all expiring in 2006). These facilities are with a number of international banks
and borrowings under them would be at pre-agreed rates. Certain of these facilities support the group’s commercial paper programme.
At 31 December 2006, the group’s share of third-party finance debt of jointly controlled entities and associates was $4,942 million
(2005 $3,266 million) and $1,143 million (2005 $970 million) respectively. These amounts are not reflected in the group’s debt on the balance sheet.
We have in place a European Debt Issuance Programme (DIP) under which the group may raise $10 billion of debt for maturities of one month or
longer. At 31 December 2006 the amount drawn down against the DIP was $7,893 million. In addition, the group has in place a US Shelf Registration
under which it may raise $10 billion of debt with maturities of one month or longer. At 31 December 2006 there had not been any draw-down.