BP 2006 Annual Report Download - page 54
Download and view the complete annual report
Please find page 54 of the 2006 BP annual report below. You can navigate through the pages in the report by either clicking on the pages listed below, or by using the keyword search tool below to find specific information within the annual report.-
 1
1 -
2
-
3
-
4
-
5
-
6
-
7
-
8
-
9
-
10
-
11
-
12
-
13
-
14
-
15
-
16
-
17
-
18
-
19
-
20
-
21
-
22
-
23
-
24
-
25
-
26
-
27
-
28
-
29
-
30
-
31
-
32
-
33
-
34
-
35
-
36
-
37
-
38
-
39
-
40
-
41
-
42
-
43
-
 44
44 -
 45
45 -
 46
46 -
 47
47 -
 48
48 -
 49
49 -
 50
50 -
 51
51 -
 52
52 -
 53
53 -
 54
54 -
 55
55 -
 56
56 -
 57
57 -
 58
58 -
 59
59 -
 60
60 -
 61
61 -
 62
62 -
 63
63 -
 64
64 -
65
-
66
-
67
-
68
-
69
-
70
-
71
-
72
-
73
-
74
-
75
-
76
-
77
-
78
-
79
-
80
-
81
-
82
-
83
-
84
-
85
-
86
-
87
-
88
-
89
-
90
-
91
-
92
-
93
-
94
-
95
-
96
-
97
-
98
-
99
-
100
-
101
-
102
-
103
-
104
-
105
-
106
-
107
-
108
-
109
-
110
-
111
-
112
-
113
-
114
-
115
-
116
-
117
-
118
-
119
-
120
-
121
-
122
-
123
-
124
-
125
-
126
-
127
-
128
-
129
-
130
-
131
-
132
-
133
-
134
-
135
-
136
-
137
-
138
-
139
-
140
-
141
-
142
-
143
-
144
-
145
-
146
-
147
-
148
-
149
-
150
-
151
-
152
-
153
-
154
-
155
-
156
-
157
-
158
-
159
-
160
-
161
-
162
-
163
-
164
-
165
-
166
-
167
-
168
-
169
-
170
-
171
-
172
-
173
-
174
-
175
-
176
-
177
-
178
-
179
-
180
-
181
-
182
-
183
-
184
-
185
-
186
-
187
-
188
-
189
-
190
-
191
-
192
-
193
-
194
-
195
-
196
-
197
-
198
-
199
-
200
-
201
-
202
-
203
-
204
-
205
-
206
-
207
-
208
-
209
-
210
-
211
-
212
-
213
-
214
-
215
-
216
-
217
-
218
-
219
-
220
-
221
-
222
-
223
-
224
-
225
-
226
-
227
-
228
 |
 |

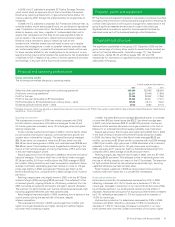
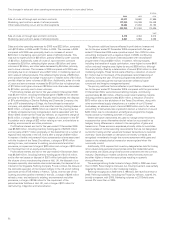
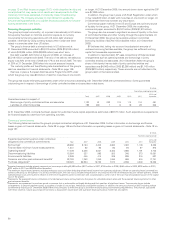
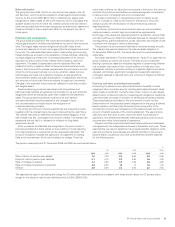
The changes in sales and other operating revenues are explained in more detail below.
$million
------------------------------------------------------------------------------------------------------------------------------------------------------------------------------------------------------------------------------------------------------------------------------------------------------------
2006 2005 2004
------------------------------------------------------------------------------------------------------------------------------------------------------------------------------------------------------------------------------------------------------------------------------------------------------------
Sale of crude oil through spot and term contracts 38,577 36,992 21,989
Marketing, spot and term sales of refined products 177,995 155,098 124,458
Other sales including non-oil and to other segments 16,283 21,236 24,192
------------------------------------------------------------------------------------------------------------------------------------------------------------------------------------------------------------------------------------------------------------------------------------------------------------
232,855 213,326 170,639
mb/d
------------------------------------------------------------------------------------------------------------------------------------------------------------------------------------------------------------------------------------------------------------------------------------------------------------
Sale of crude oil through spot and term contracts 2,110 2,464 2,312
Marketing, spot and term sales of refined products 5,801 5,888 6,398
Sales and other operating revenues for 2006 was $233 billion, compared
with $213 billion in 2005 and $171 billion in 2004. The increase in 2006
compared with 2005 was principally due to an increase of around
$23 billion in marketing, spot and term sales of refined products. This
was due to higher prices of $25 billion, partially offset by lower volumes
of $2 billion. Additionally, sales of crude oil, spot and term contracts
increased by $2 billion, reflecting higher prices of $6 billion and lower
volumes of $4 billion, and other sales decreased by $5 billion, primarily
due to lower volumes. The increase in 2005 compared with 2004 was
principally due to an increase of around $31 billion in marketing, spot and
term sales of refined products. This reflected higher prices of $39 billion
and a positive foreign exchange impact due to a weaker dollar of $1 billion,
partially offset by lower volumes of $9 billion. Additionally, sales of crude
oil, spot and term contracts increased by $15 billion due to higher prices
of $13 billion and higher volumes of $2 billion and other sales decreased
by $3 billion, primarily due to lower volumes.
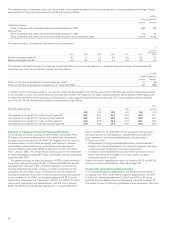
Profit before interest and tax for the year ended 31 December 2006
was $5,041 million, including net disposal gains of $884 million (related
primarily to the sale of BP’s Czech Republic retail business, the disposal
of BP’s shareholding in Zhenhai Refining and Chemicals Company, the
sale of BP’s shareholding in Eiffage, the French-based construction
company, and pipelines assets), and was after inventory holding losses of
$242 million, a charge of $925 million as a result of the ongoing review
of fatality and personal injury compensation claims associated with the
March 2005 incident at the Texas City refinery, an impairment charge of
$155 million, a charge of $155 million in respect of a donation to the BP
Foundation and a charge of $33 million relating to new, and revisions to
existing, environmental and other provisions.
Profit before interest and tax for the year ended 31 December 2005
was $6,926 million, including inventory holding gains of $2,532 million
and net gains of $177 million principally on the divestment of a number of
regional retail networks in the US, and is after a charge of $700 million
in respect of fatality and personal injury compensation claims associated
with the incident at the Texas City refinery, a charge of $140 million
relating to new, and revisions to existing, environmental and other
provisions, an impairment charge of $93 million and a charge of $33 million
for the impairment of an equity-accounted entity.
Profit before interest and tax for the year ended 31 December 2004
was $6,506 million, including inventory holding gains of $1,312 million,
and is after net losses on disposal of $267 million (principally related to
the closure of two manufacturing plants at Hull, UK, the disposal of our
European speciality intermediate chemicals business, the disposal of our
interest in the Singapore Refining Company Private Limited, the closure of
the lubricants operation of the Coryton refinery in the UK and of refining
operations at the ATAS refinery in Mersin, Turkey, and the sale of the
Cushing and other pipeline interests in the US), a charge of $206 million
related to new, and revisions to existing, environmental and other
provisions, a charge of $195 million for the impairment of the
petrochemicals facilities at Hull, UK, and a charge of $32 million for
restructuring, integration and rationalization.
The primary additional factors reflected in profit before interest and
tax for the year ended 31 December 2006 compared with the year
ended 31 December 2005 were a positive impact from IFRS fair value
accounting (compared with a negative impact in 2005), contributing
around $500 million, and lower costs associated with rationalization
programmes of around $320 million. In addition, refining margins,
including the benefits of supply optimization, were higher by some $400
million and retail margins were higher by around $600 million, although
this was partially offset by a deterioration of around $150 million in other
marketing margins. These factors were offset by a reduction of around
$1.1 billion due to the impact of the progressive recommissioning of
Texas City during the year. Efficiency programmes delivered lower
operating costs although the savings have been offset by higher
turnaround and integrity management spend.
The primary additional factors reflected in profit before interest and
tax for the year ended 31 December 2005, compared with the year ended
31 December 2004, were improved refining margins, contributing
approximately $2,000 million, offset by lower retail marketing margins,
reducing profits by approximately $720 million, a reduction of around
$870 million due to the shutdown of the Texas City refinery, along with
other storm-related supply disruptions to a number of our US-based
businesses, an adverse impact of around $400 million due to fair value
accounting for derivatives (see explanation below), a reduction of around
$430 million due to rationalization and efficiency programme charges,
mainly across our marketing activities in Europe.
Where derivative instruments are used to manage certain economic
exposures that cannot themselves be fair valued or accounted for as
hedges, timing differences in relation to the recognition of gains and
losses occur. These economic exposures primarily relate to inventories
held in excess of normal operating requirements that are not designated
as held for trading and fair valued and forecast transactions to replenish
inventory. Gains and losses on derivative commodity contracts are
recognized immediately through the income statement while gains and
losses on the related physical transaction are recognized when the
commodity is sold.
Additionally, IFRS requires that inventory designated as held for trading
is fair valued using period end spot prices while the related derivative
instruments are valued using forward prices consistent with the contract
maturity. Depending on market conditions, these forward prices can
be either higher or lower than spot prices resulting in quarterly
timing differences.
The average refining Global Indicator Margin (GIM) in 2006 was lower
than in 2005. Retail margins improved, but this improvement was partially
negated by deterioration in other marketing margins.
Refining throughputs in 2006 were 2,198mb/d, 201mb/d lower than in
2005. Refining availability, excluding the Texas City refinery, was 95.7%,
broadly consistent with 2005. Marketing volumes at 3,872mb/d were
around 2% lower than in 2005.
52