Albertsons 2013 Annual Report Download - page 96
Download and view the complete annual report
Please find page 96 of the 2013 Albertsons annual report below. You can navigate through the pages in the report by either clicking on the pages listed below, or by using the keyword search tool below to find specific information within the annual report.-
 1
1 -
2
-
3
-
4
-
5
-
6
-
7
-
8
-
9
-
10
-
11
-
12
-
13
-
14
-
15
-
16
-
17
-
18
-
19
-
20
-
21
-
22
-
23
-
24
-
25
-
26
-
27
-
28
-
29
-
30
-
31
-
32
-
33
-
34
-
35
-
36
-
37
-
38
-
39
-
40
-
41
-
42
-
43
-
44
-
45
-
46
-
47
-
48
-
49
-
50
-
51
-
52
-
53
-
54
-
55
-
56
-
57
-
58
-
59
-
60
-
61
-
62
-
63
-
64
-
65
-
66
-
67
-
68
-
69
-
70
-
71
-
72
-
73
-
74
-
75
-
76
-
77
-
78
-
79
-
80
-
81
-
82
-
83
-
84
-
85
-
 86
86 -
 87
87 -
 88
88 -
 89
89 -
 90
90 -
 91
91 -
 92
92 -
 93
93 -
 94
94 -
 95
95 -
 96
96 -
 97
97 -
 98
98 -
 99
99 -
 100
100 -
 101
101 -
 102
102 -
 103
103 -
 104
104 -
 105
105 -
 106
106 -
107
-
108
-
109
-
110
-
111
-
112
-
113
-
114
-
115
-
116
-
117
-
118
-
119
-
120
-
121
-
122
-
123
-
124
-
125
-
126
-
127
-
128
-
129
-
130
-
131
-
132
 |
 |

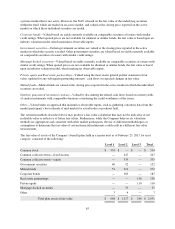
The Company offers a wide variety of nationally advertised brand name and private-label products, primarily
including grocery (both perishable and nonperishable), general merchandise and health and beauty care,
pharmacy and fuel, which are sold through the Company’s owned and licensed and franchised retail stores to
shoppers and through its Independent Business to independent retail customers. The amounts and percentages of
Net sales for each group of similar products sold in the Retail Food, Save-A-Lot and Independent Business
segments consisted of the following:
2013 2012 2011
Retail Food:
Nonperishable grocery products (1) $ 2,689 16% $ 2,820 17% $ 2,938 17%
Perishable grocery products (2) 1,428 8 1,461 8 1,508 8
Pharmacy products 512 3 483 3 465 3
Fuel 77 — 126 1 110 1
Other 30 — 31 — 33 —
4,736 27% 4,921 29% 5,054 29%
Save-A-Lot:
Nonperishable grocery products (1) $ 2,865 17% $ 2,925 17% $ 2,705 15%
Perishable grocery products (2) 1,330 8 1,296 7 1,185 7
4,195 25% 4,221 24% 3,890 22%
Independent Business:
Product sales to independent retail customers $ 8,160 48% $ 8,194 47% $ 8,400 49%
Services to independent retail customers 6 — — — 13 —
8,166 48% 8,194 47% 8,413 49%
Net sales $17,097 100% $17,336 100% $17,357 100%
(1) Includes such items as dry goods, general merchandise, health and beauty care, beverages, dairy, frozen
foods, and candy
(2) Includes such items as meat, produce, deli and bakery
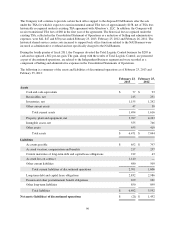
NOTE 15—DISCONTINUED OPERATIONS AND DIVESTITURES
Discontinued Operations
On January 10, 2013, the Company, AB Acquisition LLC (“AB Acquisition”) and NAI, entered into a Stock
Purchase Agreement (the “Stock Purchase Agreement”) providing for the sale by the Company of its Albertsons,
Acme, Jewel-Osco, Shaw’s and Star Market banners and related Osco and Sav-on in-store pharmacies
(collectively, the “NAI Banners”) to AB Acquisition. The stock sale (or “divestiture”) closed on March 21, 2013.
The Company received net proceeds of approximately $100, and notes receivable of approximately $44 in
exchange for the stock of NAI. AB Acquisition also assumed approximately $3,200 of debt and capital leases. In
addition, AB Acquisition also assumed the underfunded status of NAI related share of the multiemployer pension
plans to which the Company contributes. AB Acquisition’s portion of the unfunded status of the multiemployer
pension plans was estimated to be approximately $1,138 before tax, based on the Company’s estimated
“proportionate share” of underfunding calculated as of February 23, 2013.
94