Albertsons 2013 Annual Report Download - page 34
Download and view the complete annual report
Please find page 34 of the 2013 Albertsons annual report below. You can navigate through the pages in the report by either clicking on the pages listed below, or by using the keyword search tool below to find specific information within the annual report.-
 1
1 -
2
-
3
-
4
-
5
-
6
-
7
-
8
-
9
-
10
-
11
-
12
-
13
-
14
-
15
-
16
-
17
-
18
-
19
-
20
-
21
-
22
-
23
-
 24
24 -
 25
25 -
 26
26 -
 27
27 -
 28
28 -
 29
29 -
 30
30 -
 31
31 -
 32
32 -
 33
33 -
 34
34 -
 35
35 -
 36
36 -
 37
37 -
 38
38 -
 39
39 -
 40
40 -
 41
41 -
 42
42 -
 43
43 -
 44
44 -
45
-
46
-
47
-
48
-
49
-
50
-
51
-
52
-
53
-
54
-
55
-
56
-
57
-
58
-
59
-
60
-
61
-
62
-
63
-
64
-
65
-
66
-
67
-
68
-
69
-
70
-
71
-
72
-
73
-
74
-
75
-
76
-
77
-
78
-
79
-
80
-
81
-
82
-
83
-
84
-
85
-
86
-
87
-
88
-
89
-
90
-
91
-
92
-
93
-
94
-
95
-
96
-
97
-
98
-
99
-
100
-
101
-
102
-
103
-
104
-
105
-
106
-
107
-
108
-
109
-
110
-
111
-
112
-
113
-
114
-
115
-
116
-
117
-
118
-
119
-
120
-
121
-
122
-
123
-
124
-
125
-
126
-
127
-
128
-
129
-
130
-
131
-
132
 |
 |
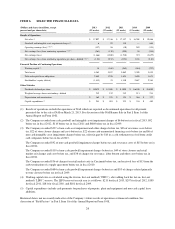
costs. Excluding these items, the remaining increase in operating earnings is primarily the result of reduction in
Selling and administrative expenses due to lower employee-related costs and increased Gross profit within the
Save-A-Lot business from higher sales and stronger margin, offset in part by a decline in the Independent
Business sales volume.
Retail Food operating loss for fiscal 2012 was $328 or negative 6.7 percent of Retail Food net sales compared
with an operating loss of $415 or negative 8.2 percent of Retail Food net sales for fiscal 2011. The $87
improvement in fiscal 2012 Retail Food over 2011 primarily reflects $18 of net lower goodwill and intangible
asset impairment charges, and $60 of lower net charges related to store closure and exit costs, and labor buyouts,
than recorded in fiscal 2011.
Save-A-Lot operating earnings for fiscal 2012 were $232, or 5.5 percent of Save-A-Lot net sales, compared with
$197, or 5.1 percent of Save-A-Lot net sales, in fiscal 2011. The increase of in Operating earnings is primarily
due to impacts from increased volume and price pass through variance to inflation and reduced advertising.
Independent Business operating earnings for fiscal 2012 were $243, or 3.0 percent of Independent Business net
sales, compared with $257, or 3.1 percent of Independent Business net sales in fiscal 2011. The decrease in
Independent Business operating earnings is due to a higher LIFO charge and impacts from a national retail
customer’s transition to self-distribution in fiscal 2012.
Interest Expense, Net
Net interest expense was $247 in fiscal 2012, compared with $230 in fiscal 2011, primarily reflecting a mix of
higher rate debt in fiscal 2012 compared to fiscal 2011.
Income Tax Benefit
The income tax benefit for fiscal 2012 was $41 compared with an income tax benefit of $60 for fiscal 2011.
Income tax benefit for fiscal 2012 and 2011 reflect the operating losses arising during the respective years.
Net Loss from Continuing Operations
Net loss from continuing operations was $110, or $0.52 per basic and diluted share, for fiscal 2012 compared
with a Net loss from continuing operations of $200, or $0.94 per basic and diluted share for fiscal 2011. Net loss
from continuing operations for fiscal 2012 includes goodwill impairment charges of $90 after tax, or $0.43 per
basic and diluted share and employee related severance charges of $10 after tax, or $0.05 per basic and diluted
share. Net Loss from continuing operations for fiscal 2011 includes goodwill impairment charges of $109 after
tax or $0.51 per basic and diluted share, store closure and market exit costs and certain other costs consisting
primarily of labor buyout costs of $60 after tax, or $0.29 per basic and diluted share. Excluding these items, the
$21 decrease in net loss is primarily the result of reduction in Selling and administrative expenses due to lower
employee-related costs and increased Gross profit within the Save-A-Lot business from higher sales and stronger
margin offset in part by a decline in the Independent Business sales volume and higher interest expense.
Loss from Discontinued Operations, net of income taxes
As a result of the NAI Banner Sale, the financial results for those operations are now presented as discontinued
operations.
Net sales for discontinued operations were $18,764 for fiscal 2012 compared with $20,177 for fiscal 2011, a
decrease of $1,413 or 7.0 percent. Sales decreased primarily due to negative identical store sales of 3.7 percent or
$700. In addition, closed stores net of new stores and change in fuel sales resulted in decreased sales of $482 and
the sale of Total Logistic Control resulted in a decrease of $210.
32