Albertsons 2013 Annual Report Download - page 59
Download and view the complete annual report
Please find page 59 of the 2013 Albertsons annual report below. You can navigate through the pages in the report by either clicking on the pages listed below, or by using the keyword search tool below to find specific information within the annual report.-
 1
1 -
2
-
3
-
4
-
5
-
6
-
7
-
8
-
9
-
10
-
11
-
12
-
13
-
14
-
15
-
16
-
17
-
18
-
19
-
20
-
21
-
22
-
23
-
24
-
25
-
26
-
27
-
28
-
29
-
30
-
31
-
32
-
33
-
34
-
35
-
36
-
37
-
38
-
39
-
40
-
41
-
42
-
43
-
44
-
45
-
46
-
47
-
48
-
 49
49 -
 50
50 -
 51
51 -
 52
52 -
 53
53 -
 54
54 -
 55
55 -
 56
56 -
 57
57 -
 58
58 -
 59
59 -
 60
60 -
 61
61 -
 62
62 -
 63
63 -
 64
64 -
 65
65 -
 66
66 -
 67
67 -
 68
68 -
 69
69 -
70
-
71
-
72
-
73
-
74
-
75
-
76
-
77
-
78
-
79
-
80
-
81
-
82
-
83
-
84
-
85
-
86
-
87
-
88
-
89
-
90
-
91
-
92
-
93
-
94
-
95
-
96
-
97
-
98
-
99
-
100
-
101
-
102
-
103
-
104
-
105
-
106
-
107
-
108
-
109
-
110
-
111
-
112
-
113
-
114
-
115
-
116
-
117
-
118
-
119
-
120
-
121
-
122
-
123
-
124
-
125
-
126
-
127
-
128
-
129
-
130
-
131
-
132
 |
 |

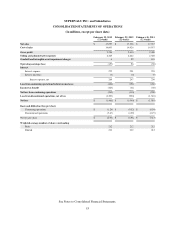
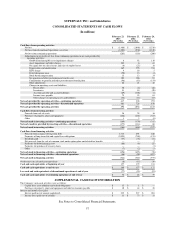
SUPERVALU INC. and Subsidiaries
CONSOLIDATED STATEMENTS OF CASH FLOWS
(In millions)
February 23,
2013
(52 weeks)
February 25,
2012
(52 weeks)
February 26,
2011
(52 weeks)
Cash flows from operating activities
Net loss $ (1,466) $ (1,040) $ (1,510)
Net loss from discontinued operations, net of tax (1,203) (930) (1,310)
Net loss from continuing operations (263) (110) (200)
Adjustments to reconcile net loss from continuing operations to net cash provided by
operating activities:
Goodwill and intangible asset impairment charges 6 92 110
Asset impairment and other charges 283 6 63
Net (gain) loss on sale of assets and exits of surplus leases (6) (25) 18
Depreciation and amortization 365 355 354
LIFO charge 416 5
Deferred income taxes (50) 13 (4)
Stock-based compensation 13 13 14
Net pension and other postretirement benefits cost 102 106 91
Contributions to pension and other postretirement benefit plans (98) (83) (154)
Other adjustments 26 21 18
Changes in operating assets and liabilities:
Receivables 30 (6) (26)
Inventories 51 10 (20)
Accounts payable and accrued liabilities (69) (108) (4)
Income taxes payable 75 55 81
Other changes in operating assets and liabilities (52) (27) (53)
Net cash provided by operating activities—continuing operations 417 328 293
Net cash provided by operating activities—discontinued operations 481 728 870
Net cash provided by operating activities 898 1,056 1,163
Cash flows from investing activities
Proceeds from sale of assets 38 29 16
Purchases of property, plant and equipment (228) (402) (323)
Other 1 3 (8)
Net cash used in investing activities—continuing operations (189) (370) (315)
Net cash (used in) provided by investing activities—discontinued operations (175) (114) 88
Net cash used in investing activities (364) (484) (227)
Cash flows from financing activities
Proceeds from issuance of long-term debt 1,713 291 180
Payments of long-term debt and capital lease obligations (2,099) (700) (155)
Dividends paid (37) (74) (74)
Net proceeds from the sale of common stock under option plans and related tax benefits — — 2
Payments for debt financing costs (66) (8) (25)
Payments for purchase of treasury shares — — (3)
Other (7) (2) (3)
Net cash used in financing activities—continuing operations (496) (493) (78)
Net cash used in financing activities—discontinued operations (46) (94) (897)
Net cash used in financing activities (542) (587) (975)
Net decrease in cash and cash equivalents (8) (15) (39)
Cash and cash equivalents at beginning of year 157 172 211
Cash and cash equivalents at end of year $ 149 $ 157 $ 172
Less cash and cash equivalents of discontinued operations at end of year (77) (93) (93)
Cash and cash equivalents of continuing operations at end of year $72$64$79
SUPPLEMENTAL CASH FLOW INFORMATION
The Company’s non-cash activities were as follows:
Capital lease asset additions and related obligations $ 13 $ 1 $ —
Purchases of property, plant and equipment included in Accounts payable $ 10 $ 44 $ 28
Interest and income taxes paid:
Interest paid (net of amount capitalized) $ 232 $ 227 $ 201
Income taxes paid (net of refunds) $ 31 $ 73 $ 11
See Notes to Consolidated Financial Statements.
57