Albertsons 2013 Annual Report Download - page 39
Download and view the complete annual report
Please find page 39 of the 2013 Albertsons annual report below. You can navigate through the pages in the report by either clicking on the pages listed below, or by using the keyword search tool below to find specific information within the annual report.-
 1
1 -
2
-
3
-
4
-
5
-
6
-
7
-
8
-
9
-
10
-
11
-
12
-
13
-
14
-
15
-
16
-
17
-
18
-
19
-
20
-
21
-
22
-
23
-
24
-
25
-
26
-
27
-
28
-
 29
29 -
 30
30 -
 31
31 -
 32
32 -
 33
33 -
 34
34 -
 35
35 -
 36
36 -
 37
37 -
 38
38 -
 39
39 -
 40
40 -
 41
41 -
 42
42 -
 43
43 -
 44
44 -
 45
45 -
 46
46 -
 47
47 -
 48
48 -
 49
49 -
50
-
51
-
52
-
53
-
54
-
55
-
56
-
57
-
58
-
59
-
60
-
61
-
62
-
63
-
64
-
65
-
66
-
67
-
68
-
69
-
70
-
71
-
72
-
73
-
74
-
75
-
76
-
77
-
78
-
79
-
80
-
81
-
82
-
83
-
84
-
85
-
86
-
87
-
88
-
89
-
90
-
91
-
92
-
93
-
94
-
95
-
96
-
97
-
98
-
99
-
100
-
101
-
102
-
103
-
104
-
105
-
106
-
107
-
108
-
109
-
110
-
111
-
112
-
113
-
114
-
115
-
116
-
117
-
118
-
119
-
120
-
121
-
122
-
123
-
124
-
125
-
126
-
127
-
128
-
129
-
130
-
131
-
132
 |
 |

The fair values of the Company’s reporting units are determined by using both the market approach, applying a
multiple of earnings based on guidelines for publicly traded companies, and the income approach, discounting
projected future cash flows based on management’s expectations of the current and future operating
environment. The rates used to discount projected future cash flows reflect a weighted average cost of capital
based on the Company’s industry, capital structure and risk premiums including those reflected in the current
market capitalization.
Fair value calculations contain significant judgments and estimates related to each reporting unit’s projected
weighted average cost of capital, future revenue, profitability, cash flows and fair values of assets and liabilities.
When preparing these estimates, management considers each reporting unit’s historical results, current operating
trends and specific plans in place. These estimates are impacted by variable factors including inflation, the
general health of the economy and market competition. The Company has sufficient current and historical
information available to support its judgments and estimates. However, if actual results are not consistent with
the Company’s estimates future operating results may be materially impacted.
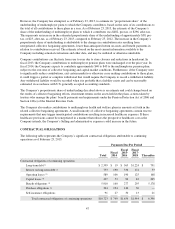
The Company’s goodwill attributable to each reporting unit consisted of the following:
Reporting Unit 2013 2012
Retail Food $—$—
Save-A-Lot 137 137
Independent Business 710 710
$ 847 $ 847
The Company performed its annual test of goodwill during the fourth quarter of fiscal 2013, utilizing discount
rates ranging between 11 percent and 15 percent to discount projected future cash flows for each reporting unit
and perpetual growth rates ranged between 1 percent and 3 percent.
Management performed sensitivity analyses on the fair values resulting from the discounted cash flow analysis
utilizing alternate assumptions that reflect reasonably possible changes to future assumptions. Based upon the
Company’s analysis of the Independent Business and Save-A-Lot reporting units, a 100 basis point increase in
the discount rate utilized in the discounted cash flow analysis would not have resulted in either reporting unit
failing step one of the impairment test. Additionally, a 100 basis point decrease in the estimated perpetual sales
growth rates utilized in the discounted cash flow analysis would not have resulted in either reporting unit failing
the first step of the impairment tests. The fair value of goodwill for the Company’s Save-A-Lot reporting was in
excess of 100 percent of the $137 carrying value. The fair value of the Company’s Independent Business
reporting unit exceeded its $710 carrying value by approximately 60 percent. If the Company’s stock price
experiences a significant and sustained decline, or other events or changes in circumstances, such as operating
results not meeting plan indicate that impairment may have occurred, the Company would reassess the fair value
of the implied goodwill compared to the carrying value.
The Company completed step one of the annual goodwill impairment evaluation during the fourth quarter for
fiscal 2013 with each reporting unit’s fair value exceeding its carrying value. Accordingly, step two of the
impairment analysis was not required for fiscal 2013.
During fiscal 2012 and 2011, the Company recorded a non-cash impairment charges of $92 and $110,
respectively in the Retail Food segment as a result of the annual goodwill impairment test. The impairment
charge resulted from the significant and sustained decline in the Company’s market capitalization. As of year-end
2012 there was no remaining goodwill related to the Retail Food segment.
37